 HoodRadar
borough · Montreal
Ahuntsic-Cartierville at a Glance
The neighbourhood report card
Overall grade : C
- DSafety21.9
- CBreak-ins5.3
- AGreen space50,959.0
- ATree canopy30.0%
How these grades are computed
Grades from A to E, computed automatically from open data (police, city, census). Each criterion ranks this neighbourhood against the other neighbourhoods of the same city: A for the best-placed fifth, E for the lowest fifth. A relative position, not a verdict.
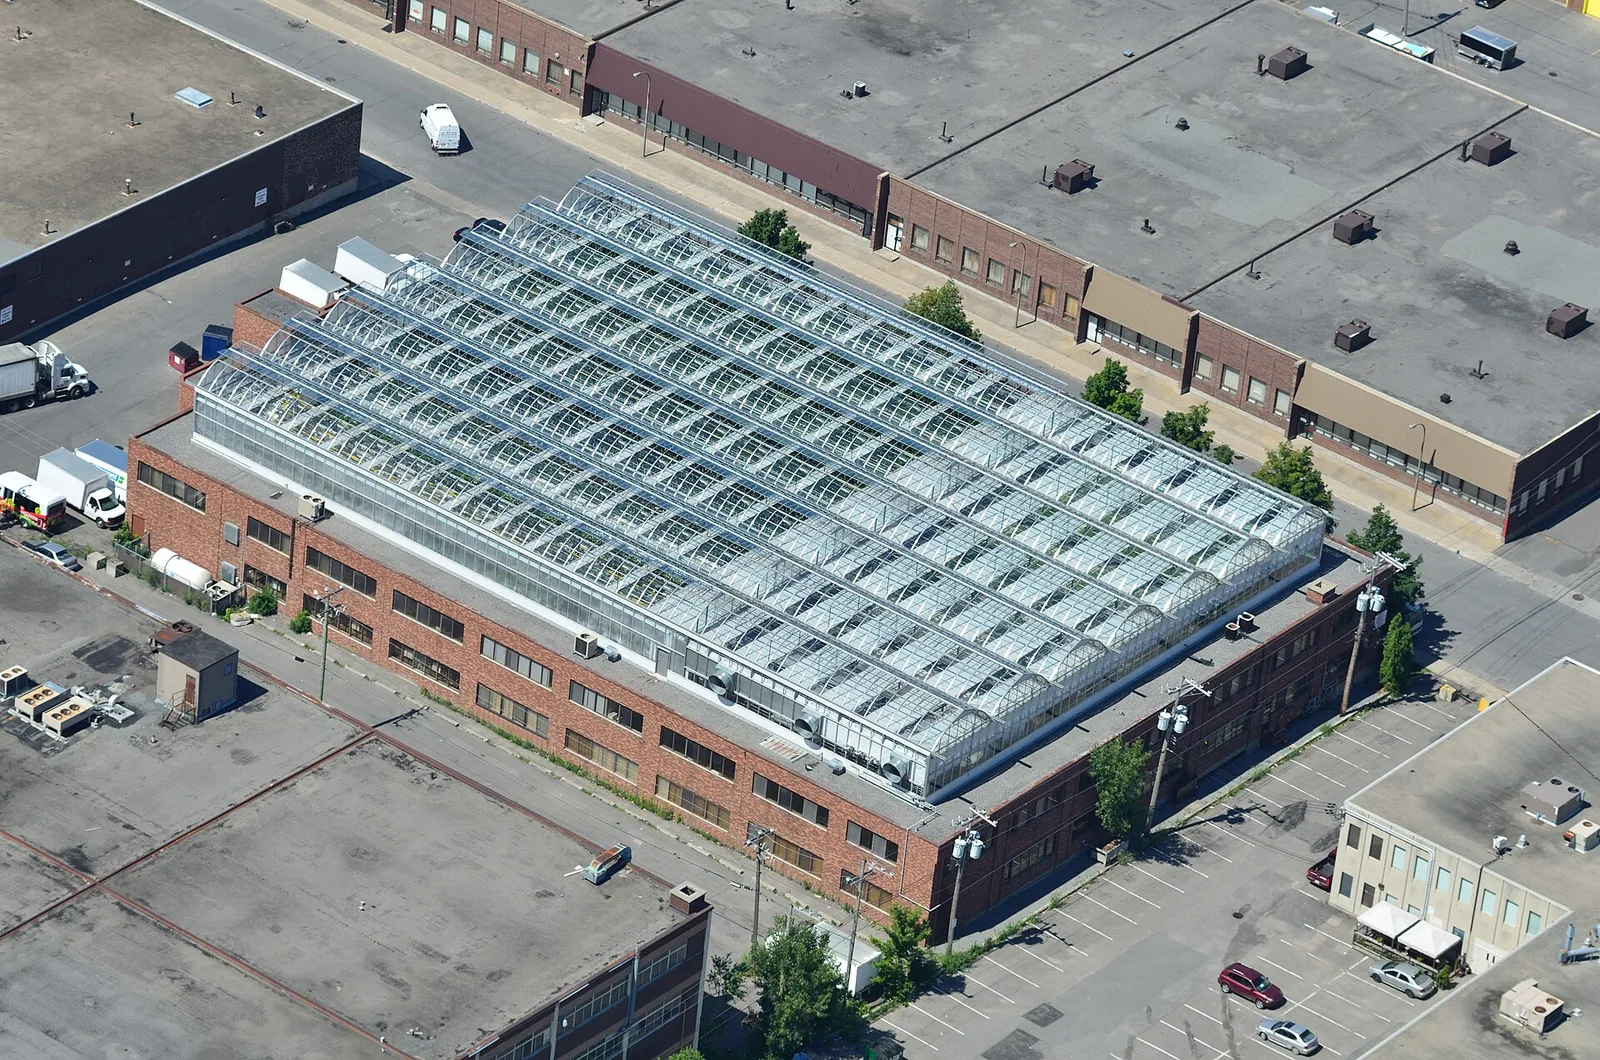
On safety, Ahuntsic-Cartierville sits close to the city average, with a rate of 21.9 against 24.1 for all boroughs combined. Its housing stock leans older, with a median construction year of 1963 and 39.3% of dwellings predating the postwar building wave's tail end. Parks cover 13.5% of the borough's land, a touch more than the citywide 10.1%.
Safety and reported crime
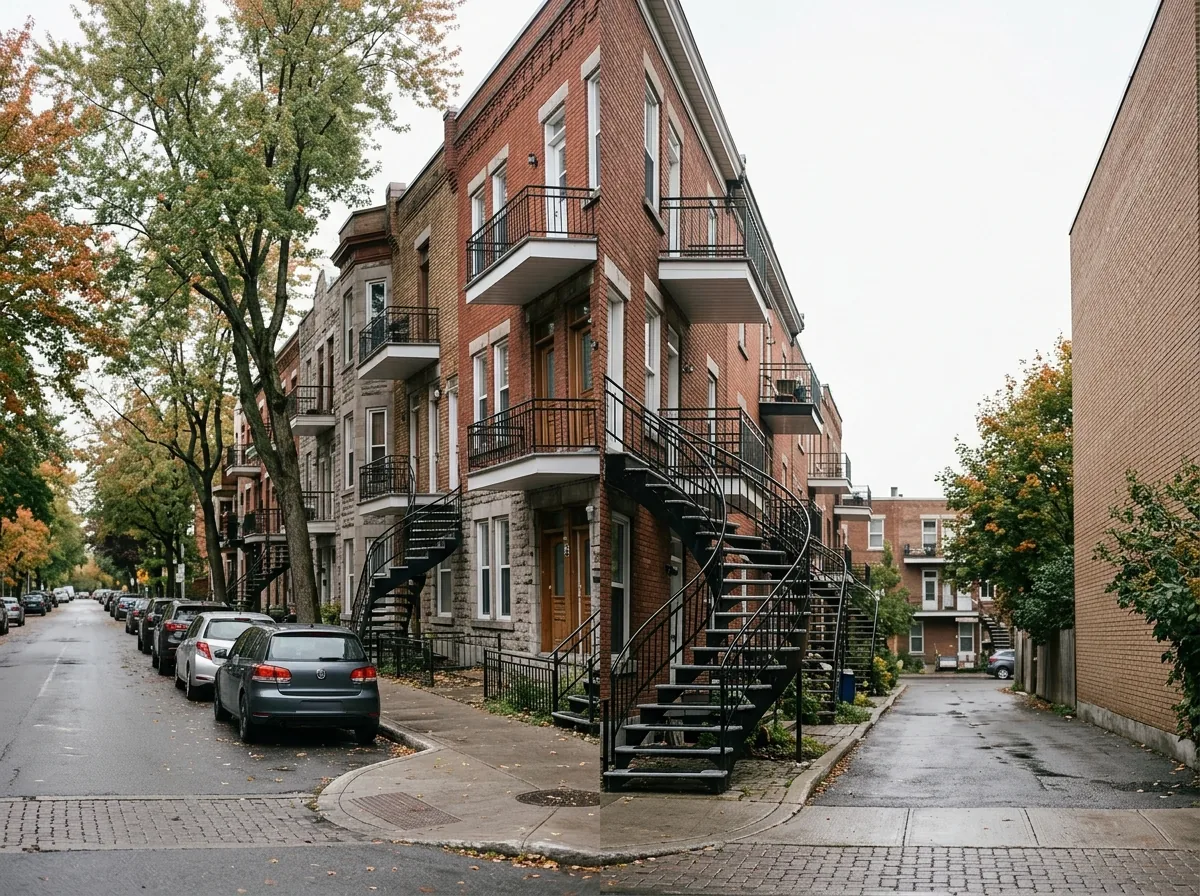
Over the most recent full year of data, police located 1,477 criminal acts in Ahuntsic-Cartierville, compared with 1,520 in the preceding equivalent period — a change of -2.8%, which the data describes as stable. Measured against the housing stock, the rate comes to 21.9, close to the city average when set beside the all-borough figure of 24.1. Among the boroughs ranked from the lowest rate upward, Ahuntsic-Cartierville places 12.
The single largest category is thefts from vehicles, accounting for 26.7% of located acts. Break-ins totalled 359, a rate of 5.3 relative to the number of dwellings versus 5.8 citywide, which puts the borough close to the city average; the year-over-year direction is stable.
One caveat worth keeping in mind when reading any borough comparison: across the city, 15.2% of published criminal acts carry no location, so borough counts understate the true total everywhere.
Break-ins per 1,000 dwellings, all boroughs : 5.8
Housing stock
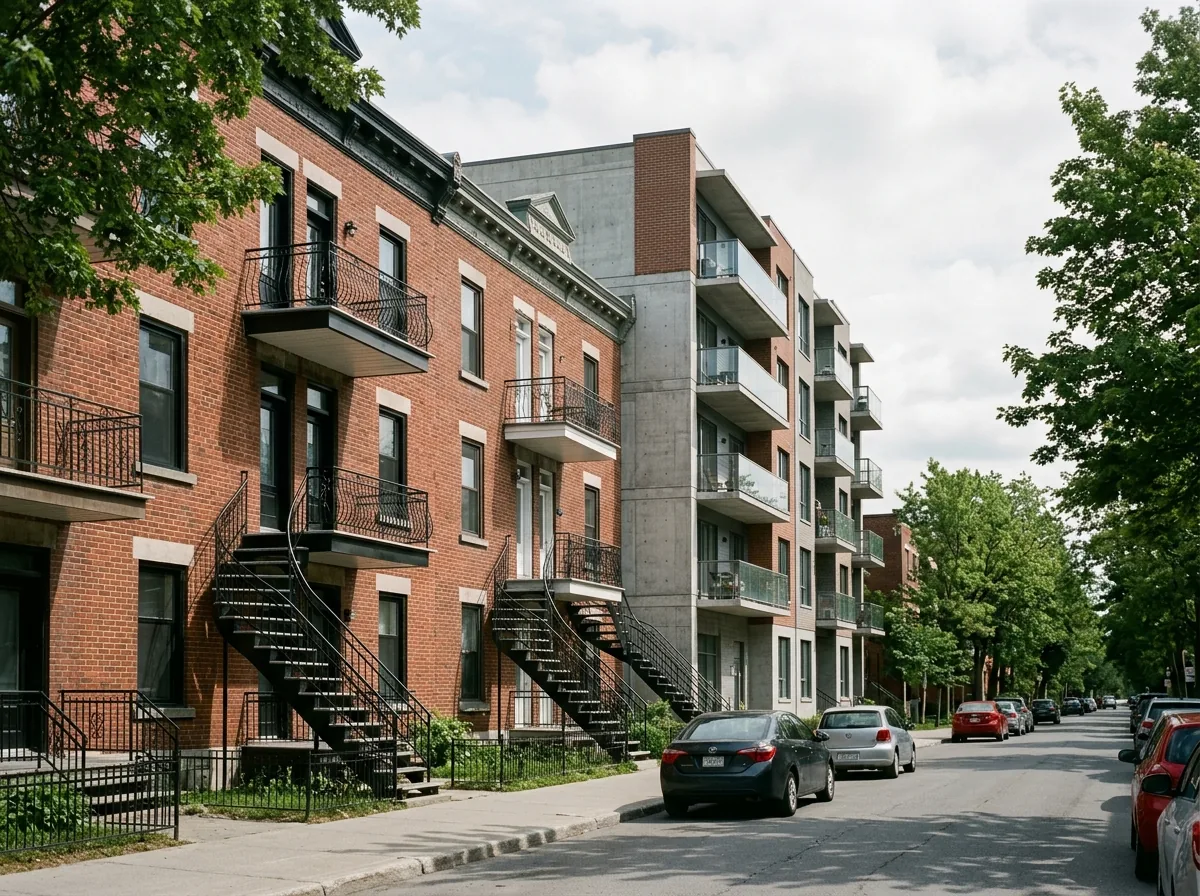
The assessment roll lists 67,523 dwellings in Ahuntsic-Cartierville. The median construction year is 1963, which places the typical building in the postwar era, though the stock is far from uniform: 39.3% of dwellings are older than that wave, a mix that shows up street by street rather than in a single pocket.
Condominium units make up 13.6% of dwellings, a modest share that leaves rental buildings and owner-occupied houses and duplexes as the bulk of what comes on the market. Buyers looking at older properties should budget for the usual questions that come with them: roofing, windows, electrical capacity and insulation.
Parks and outdoor life
The City's inventory of municipal parks and large parks counts 89 of them in Ahuntsic-Cartierville, covering 13.5% of the borough's land against 10.1% across all boroughs. That inventory includes parks and large parks only — private yards, school grounds and institutional green space are not part of it. Relative to the number of dwellings, park area works out to 50,959.0 square metres, close to the citywide 46,596.0, which is why the borough reads as close to the city average on green space per household.
The largest is Parc-nature du Bois-de-Saraguay. For families, the equipment matters more than the acreage: 61 children's playgrounds, 68 outdoor sports facilities and 18 outdoor recreation facilities are listed, part of a broader municipal inventory of 253 outdoor recreational, sports and cultural installations.
Share of land occupied by parks, all boroughs : 10.1%
Tree canopy cover, all boroughs : 24.3%
Rents in the Montréal region
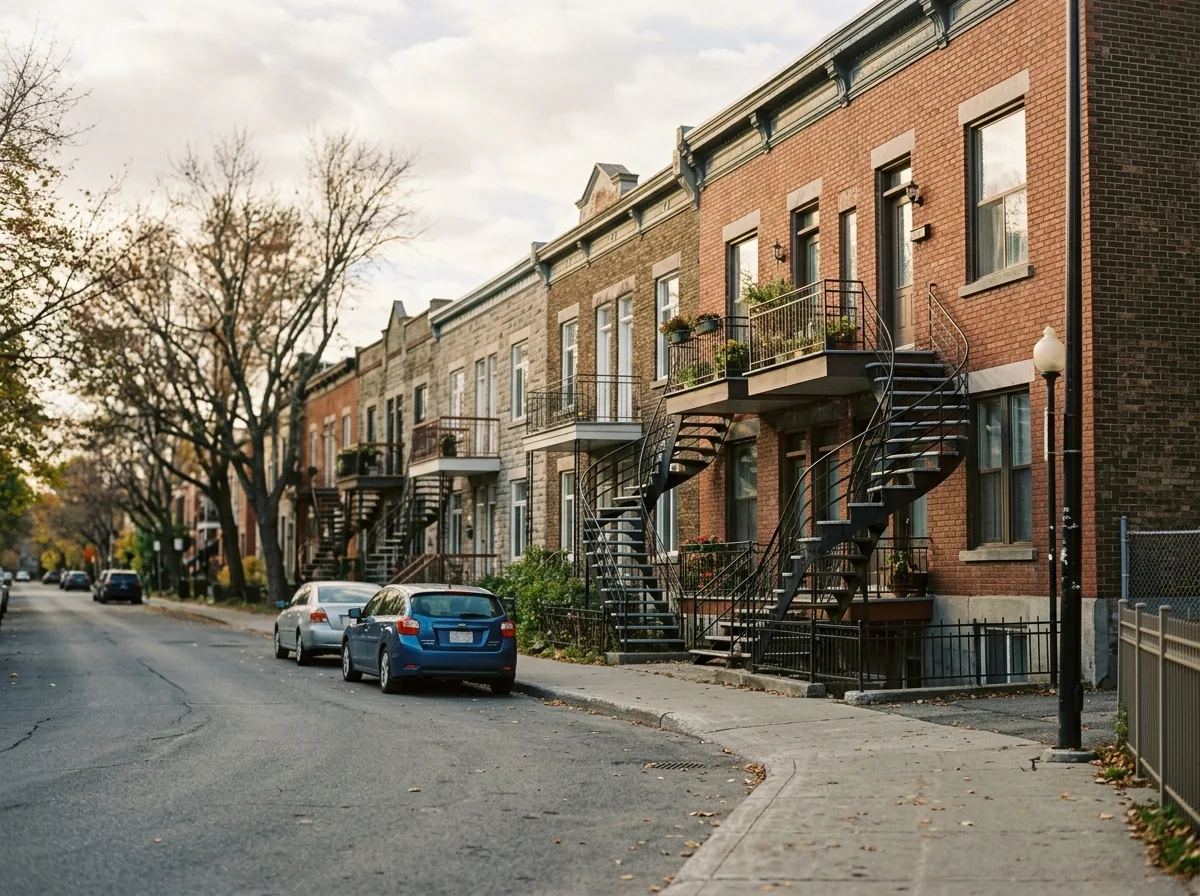
Rent figures published for the Montréal census metropolitan area describe the whole region, not Ahuntsic-Cartierville specifically; actual asking rents in any given building can sit well above or below them. For the 2025 survey, the regional averages were $1,005 for bachelor units, $1,131 for smaller apartments, $1,346 for family-sized units and $1,625 for the largest ones.
Use them as a benchmark rather than a quote. A unit in an older walk-up and a recent build with an elevator will not land at the same point around that average.
Practical notes for newcomers
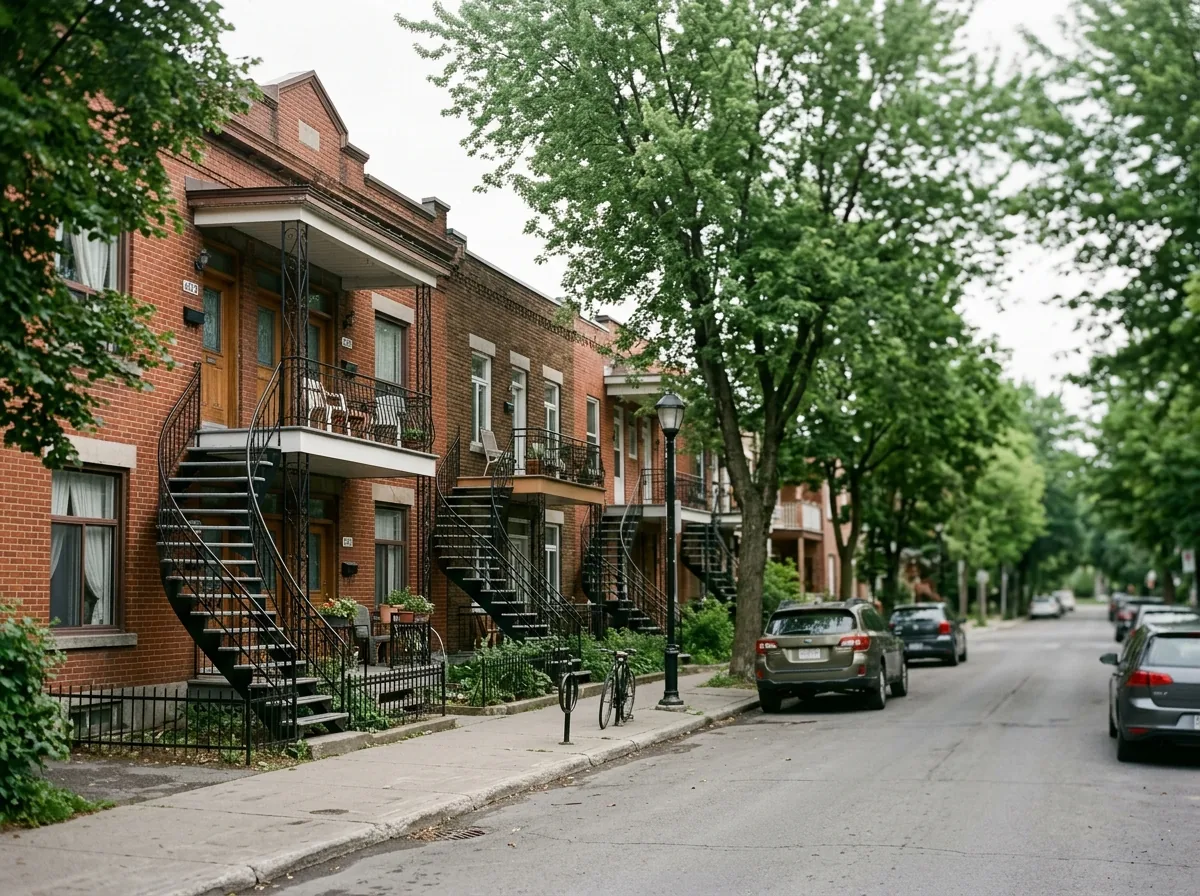
Since thefts from vehicles drives the largest share of reported acts here at 26.7%, off-street parking and an empty-looking vehicle interior do more for you than most other precautions. Break-ins sit close to the city average, so standard measures — solid door hardware, lit entrances, a neighbour who collects your mail — are proportionate to the risk the data shows.
When you shop for home insurance, insurers price on the building's characteristics as much as on the address, and with a median construction year of 1963 the age of plumbing and wiring will come up in the quote. Buyers are generally better served getting a mortgage pre-approval before visiting, since the older stock here often invites a negotiation over repairs.
Frequently asked questions
Is Ahuntsic-Cartierville a safe borough?
The data puts it close to the city average: 21.9 located criminal acts relative to the number of dwellings, against 24.1 for all boroughs combined, which ranks it 12 counting from the lowest rate. The trend is stable, with a year-over-year change of -2.8%.
How old are the buildings in Ahuntsic-Cartierville?
The median construction year is 1963, and 39.3% of the 67,523 dwellings on the assessment roll are older still. Condominiums account for 13.6% of the stock.
Does Ahuntsic-Cartierville have enough parks for families?
The City's inventory lists 89 parks and large parks covering 13.5% of the borough, with 61 children's playgrounds and 68 outdoor sports facilities. The largest is Parc-nature du Bois-de-Saraguay.
All the data
| Indicator | Value | Source |
|---|---|---|
| Share of the cycling network open in winter | 81.1% | Cycling network |
| Kilometres of cycle lanes | 75 | Cycling network |
| Break-ins (last 12 months) Period : 2025-10-01 → 2026-09-30 | 359 | Criminal acts |
| Break-ins compared with the city Period : 2025-10-01 → 2026-09-30 | close to the city average | Criminal acts |
| Break-ins per 1,000 dwellings Period : 2025-10-01 → 2026-09-30 | 5.3 | Criminal acts |
| Year-over-year break-in trend Period : 2025-10-01 → 2026-09-30 | stable | Criminal acts |
| Tree canopy cover Period : 2019 | 30.0% | Tree canopy by neighbourhood (3-30-300 rule) |
| Share of dwellings in condominiums | 13.6% | Property assessment units |
| Year-over-year change in criminal acts Period : 2025-10-01 → 2026-09-30 | -2.8% | Criminal acts |
| Crime rate compared with the city Period : 2025-10-01 → 2026-09-30 | close to the city average | Criminal acts |
| Rank by crime rate (1 = lowest) Period : 2025-10-01 → 2026-09-30 | 12 | Criminal acts |
| Criminal acts per 1,000 dwellings Period : 2025-10-01 → 2026-09-30 | 21.9 | Criminal acts |
| Year-over-year crime trend Period : 2025-10-01 → 2026-09-30 | stable | Criminal acts |
| Located criminal acts (last 12 months) Period : 2025-10-01 → 2026-09-30 | 1,477 | Criminal acts |
| Located criminal acts (previous 12 months) Period : 2024-10-01 → 2025-09-30 | 1,520 | Criminal acts |
| Dwellings on the assessment roll | 67,523 | Property assessment units |
| Park area per dwelling compared with the city | close to the city average | Large parks, borough parks and public spaces |
| Largest park in the borough | Parc-nature du Bois-de-Saraguay | Large parks, borough parks and public spaces |
| Median construction year | 1963 | Property assessment units |
| Outdoor recreation facilities | 18 | Outdoor recreational, sports and cultural facilities |
| Outdoor recreational, sports and cultural facilities | 253 | Outdoor recreational, sports and cultural facilities |
| Parks and large parks | 89 | Large parks, borough parks and public spaces |
| Share of land occupied by parks | 13.5% | Large parks, borough parks and public spaces |
| Square metres of park per 1,000 dwellings | 50,959.0 | Large parks, borough parks and public spaces |
| Children's playgrounds | 61 | Outdoor recreational, sports and cultural facilities |
| Dwellings built before 1960 | 39.3% | Property assessment units |
| Outdoor sports facilities | 68 | Outdoor recreational, sports and cultural facilities |
| Most frequent category Period : 2025-10-01 → 2026-09-30 | thefts from vehicles | Criminal acts |
| Share of the most frequent category Period : 2025-10-01 → 2026-09-30 | 26.7% | Criminal acts |
Regional context
| Indicator | Value | Source |
|---|---|---|
| Boroughs covered | 19 | Administrative boundaries of the agglomeration |
| Share of the cycling network open in winter, all boroughs | 79.0% | Cycling network |
| Kilometres of cycle lanes, all boroughs | 951 | Cycling network |
| Break-ins per 1,000 dwellings, all boroughs Period : 2025-10-01 → 2026-09-30 | 5.8 | Criminal acts |
| Tree canopy cover, all boroughs Period : 2019 | 24.3% | Tree canopy by neighbourhood (3-30-300 rule) |
| Criminal acts per 1,000 dwellings, all boroughs Period : 2025-10-01 → 2026-09-30 | 24.1 | Criminal acts |
| Share of land occupied by parks, all boroughs | 10.1% | Large parks, borough parks and public spaces |
| Square metres of park per 1,000 dwellings, all boroughs | 46,596.0 | Large parks, borough parks and public spaces |
| Average rent, Montréal CMA: one bedroom Period : 2025 | $1,131 | Average rents (Rental Market Survey) |
| Average rent, Montréal CMA: two bedrooms Period : 2025 | $1,346 | Average rents (Rental Market Survey) |
| Average rent, Montréal CMA: three bedrooms or more Period : 2025 | $1,625 | Average rents (Rental Market Survey) |
| Average rent, Montréal CMA: bachelor Period : 2025 | $1,005 | Average rents (Rental Market Survey) |
| Rent survey year | 2025 | Average rents (Rental Market Survey) |
| Share of criminal acts published without a location Period : 2025-10-01 → 2026-09-30 | 15.2% | Criminal acts |
Comments
No comments yet.