 HoodRadar
borough · Montreal
Living in Rosemont-La Petite-Patrie: What the Data Shows
The neighbourhood report card
Overall grade : C
- CSafety21.5
- DBreak-ins6.5
- DGreen space22,312.0
- CTree canopy27.1%
How these grades are computed
Grades from A to E, computed automatically from open data (police, city, census). Each criterion ranks this neighbourhood against the other neighbourhoods of the same city: A for the best-placed fifth, E for the lowest fifth. A relative position, not a verdict.
Rosemont-La Petite-Patrie sits toward the middle of Montréal's boroughs on overall crime, with a rate of 21.5 that ranks it 10 among the city's boroughs, yet its break-in rate of 6.5 runs above the citywide figure of 5.8. Housing here skews older, with a median construction year of 1955, and green space is a bit tighter than the city average per dwelling.
Crime and Break-Ins
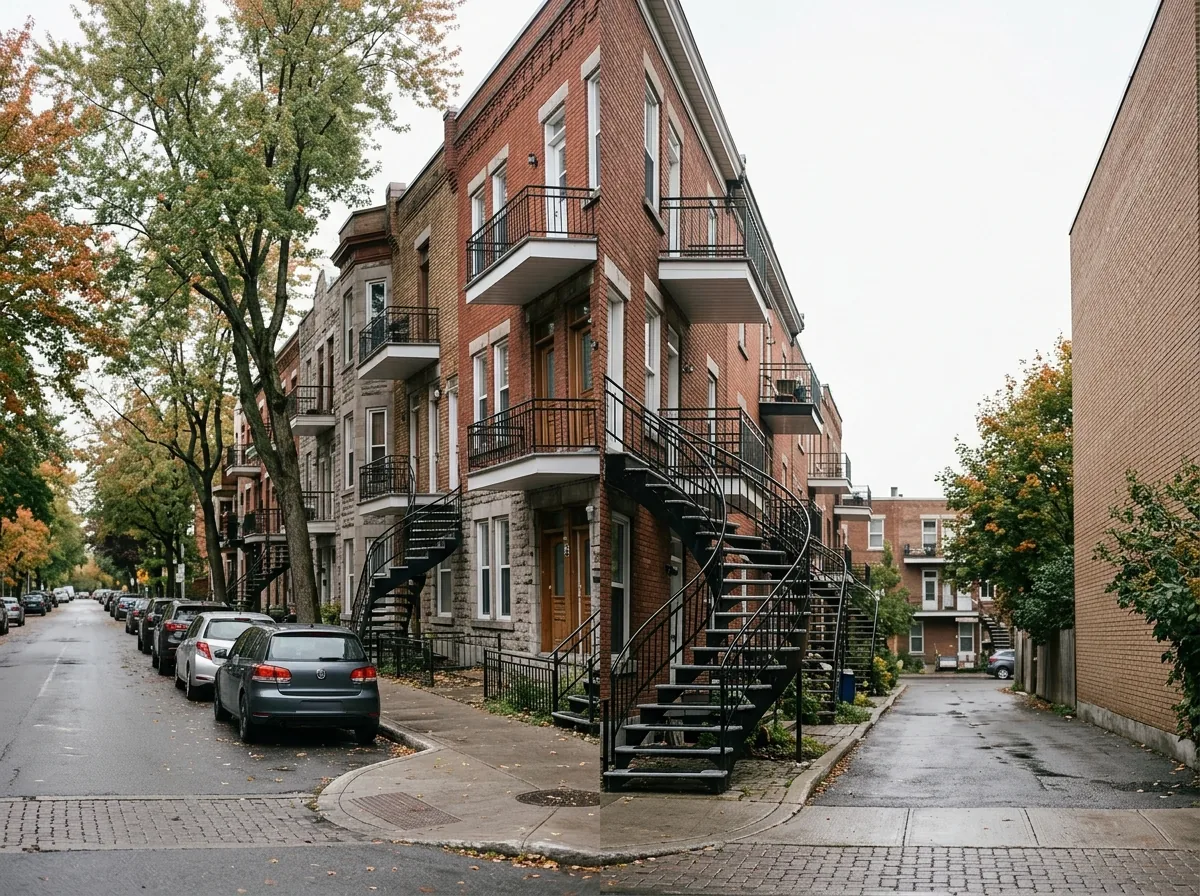
Over the most recent full year of data, Rosemont-La Petite-Patrie recorded 1,786 located criminal acts, close to the 1,779 logged the year before — a trend the data describes as stable, with a year-over-year change of 0.4%. The borough's crime rate of 21.5 per dwelling count sits below the city average, compared with 24.1 across all boroughs.
The category that comes up most often is break-ins, making up 30.2% of incidents. Break-ins specifically numbered 540 and their rate, 6.5, is above the city average relative to the city's 5.8, even as the trend for this category stays stable. Keep in mind that 15.2% of criminal acts citywide are published without a location, so any borough-level count understates the true total somewhat.
Break-ins per 1,000 dwellings, all boroughs : 5.8
Housing Stock and Building Age
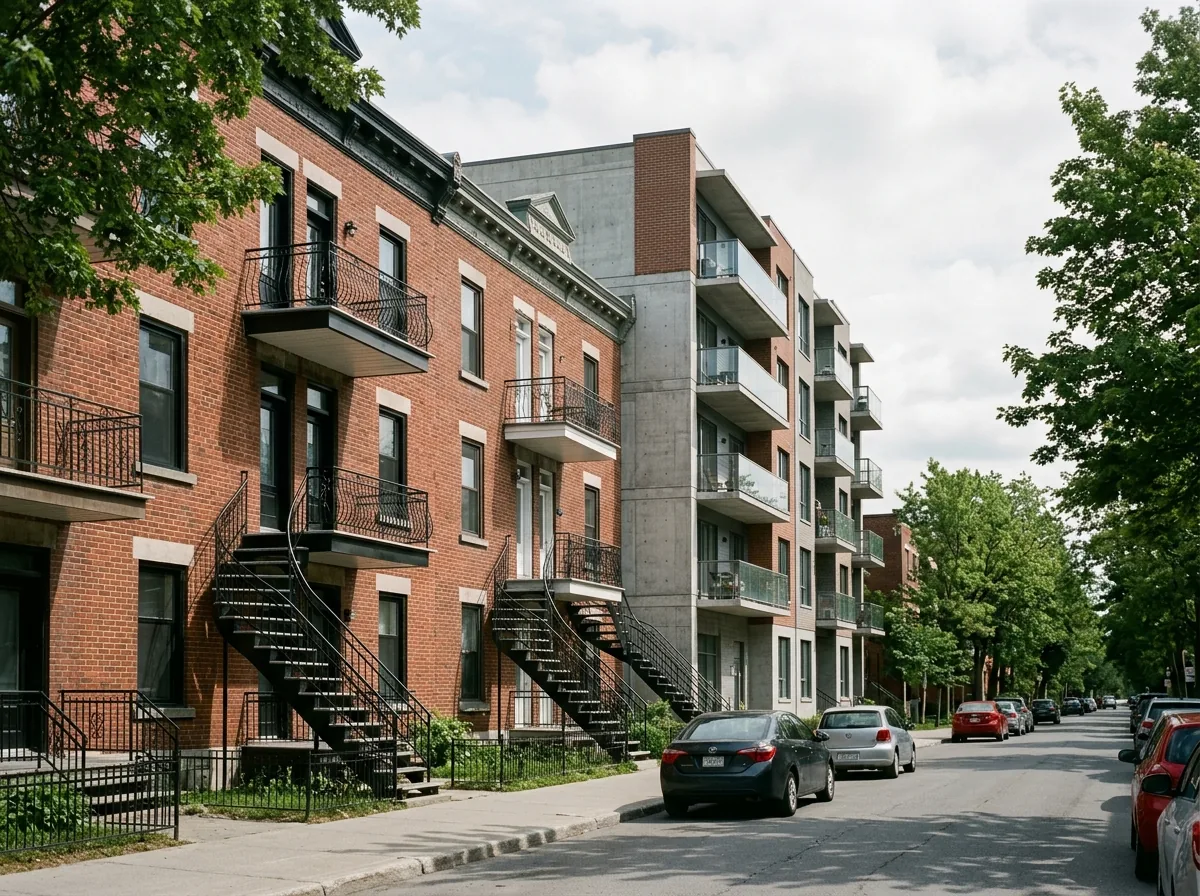
There are 82,992 dwellings on the assessment roll in Rosemont-La Petite-Patrie, and condominiums make up 15.6% of them — a meaningful share but still a minority of the housing stock. The median construction year is 1955, which places much of the borough's housing in the post-war period rather than among newer builds.
Older buildings dominate: 61.8% of dwellings predate the postwar boom entirely, a figure worth factoring into expectations around renovations, insulation and building systems when touring units here.
Parks and Outdoor Life
The City's inventory, which counts parks and large parks only and excludes private or institutional green space, lists 70 such parks in Rosemont-La Petite-Patrie, together covering 11.7% of the borough's land. That's close to the citywide share of 10.1%, though on a per-dwelling basis the borough offers 22,312.0 square metres of park space relative to its housing stock, below the citywide figure of 46,596.0 — the gap behind the below the city average comparison.
The borough's largest green space is Parc Maisonneuve, Golf municipal de Montréal. Families have access to 57 children's playgrounds and 40 outdoor sports facilities, part of a wider total of 209 outdoor recreational, sports and cultural facilities, with 11 classed specifically as outdoor recreation facilities.
Share of land occupied by parks, all boroughs : 10.1%
Tree canopy cover, all boroughs : 24.3%
Rents Across the Montréal Region
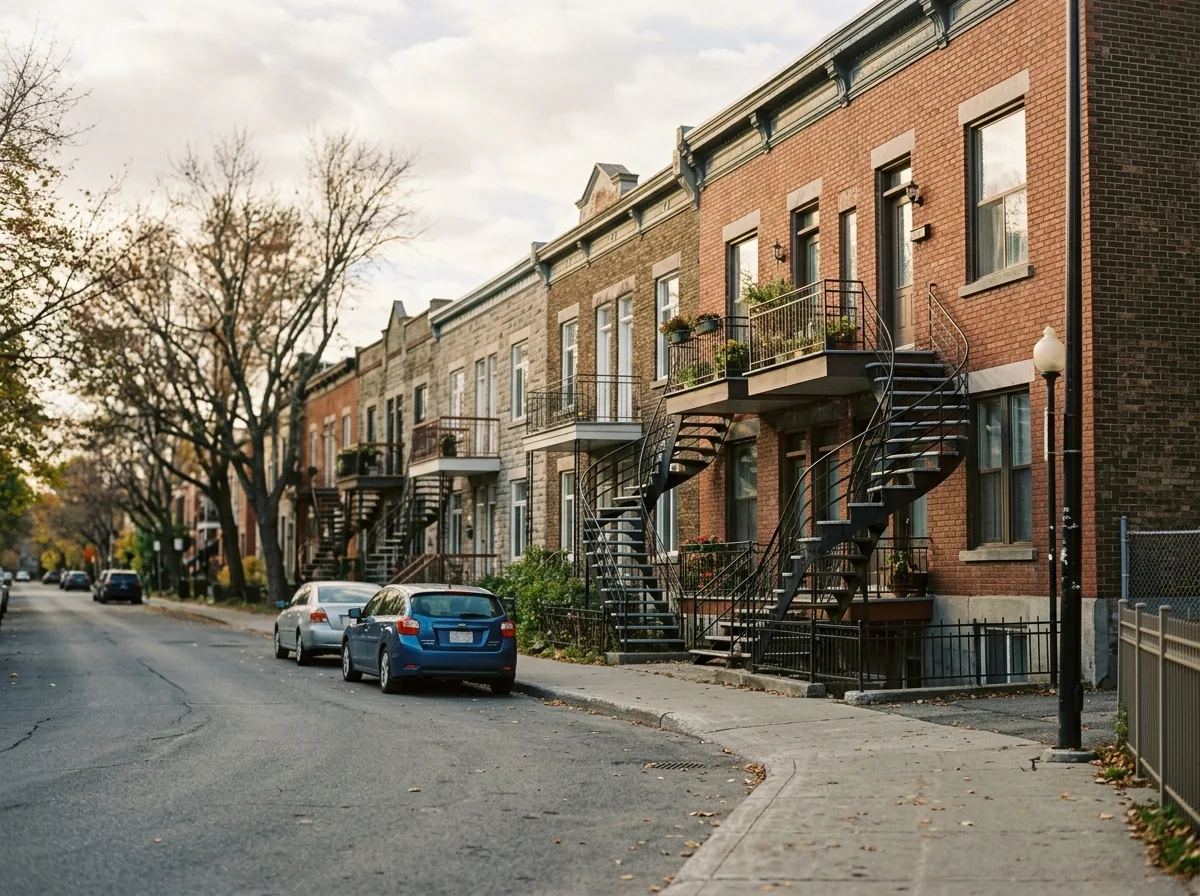
CMHC's survey figures are regional, covering the whole Montréal census metropolitan area rather than Rosemont-La Petite-Patrie specifically, so treat them as context rather than a quote for any one listing. In 2025, average rent across the CMA ran from $1,005 for bachelor units up to $1,131 for smaller units, $1,346 for family-sized units, and $1,625 for the largest units.
These regional averages help frame what a given borough might cost relative to typical results, but actual asking rents inside Rosemont-La Petite-Patrie can sit above or below them depending on the unit and building.
Practical Notes for Newcomers
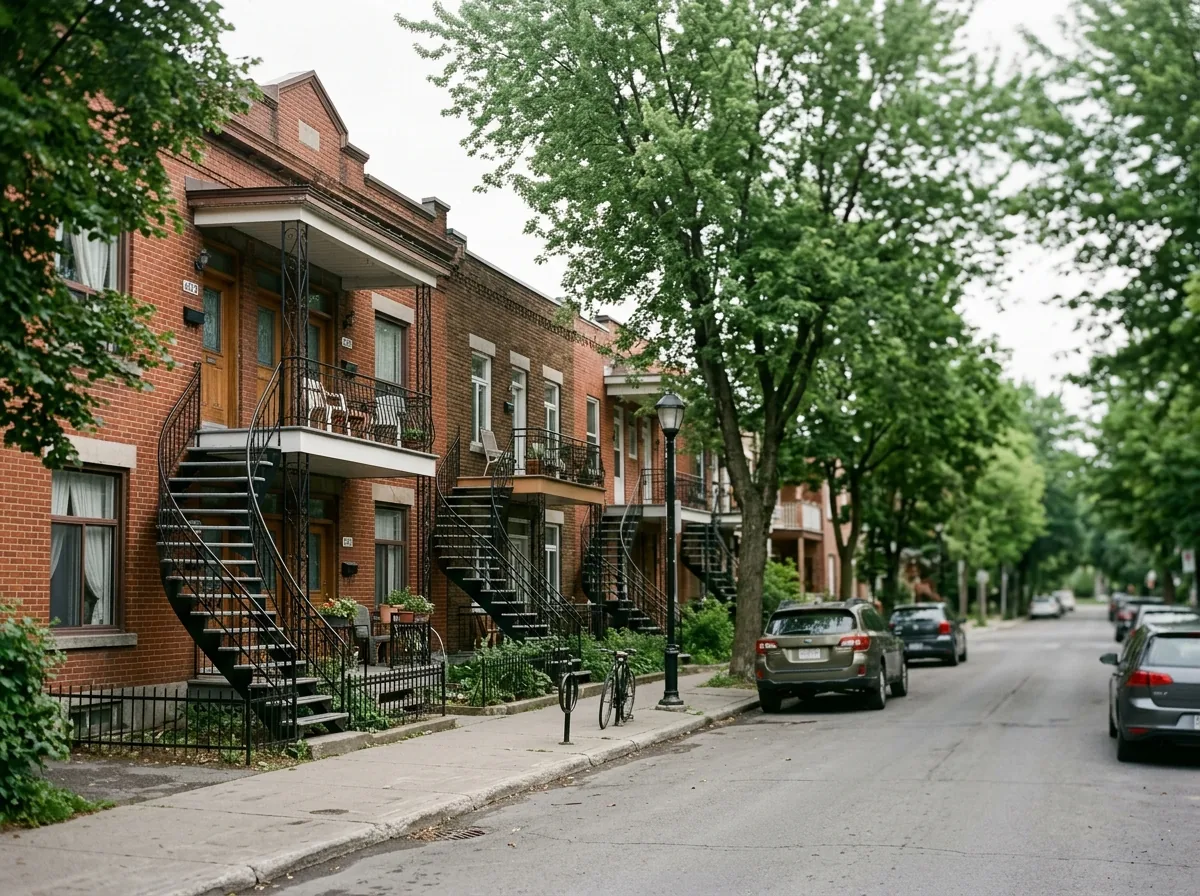
Given that break-ins in Rosemont-La Petite-Patrie run above the city average compared with the rest of the city, it's reasonable to ask about door and window security, lighting and whether a building has any shared entry system before signing a lease or an offer. Home or tenant insurance quotes often account for this kind of local risk profile, so getting a quote early in the process can avoid surprises.
With 61.8% of the housing stock built before the postwar period, a buyer may want a mortgage pre-approval that accounts for possible near-term repairs, and a professional inspection remains a sensible step regardless of a building's age. None of this replaces advice from a licensed insurance broker, mortgage professional or inspector familiar with the specific property.
Frequently asked questions
Is Rosemont-La Petite-Patrie safe compared with other Montréal boroughs?
Its overall crime rate of 21.5 per dwelling count is below the city average, ranking 10 among Montréal's boroughs, though its break-in rate of 6.5 runs above the citywide average of 5.8.
What kind of housing will I find in Rosemont-La Petite-Patrie?
The borough has 82,992 dwellings with a median construction year of 1955; 61.8% of units predate the postwar boom, and condominiums account for 15.6% of the stock.
How much green space does Rosemont-La Petite-Patrie have for families?
The City's park inventory counts 70 parks and large parks covering 11.7% of the borough's land, with 57 children's playgrounds and 40 outdoor sports facilities; the largest is Parc Maisonneuve, Golf municipal de Montréal.
All the data
| Indicator | Value | Source |
|---|---|---|
| Share of the cycling network open in winter | 86.9% | Cycling network |
| Kilometres of cycle lanes | 85 | Cycling network |
| Break-ins (last 12 months) Period : 2025-10-01 → 2026-09-30 | 540 | Criminal acts |
| Break-ins compared with the city Period : 2025-10-01 → 2026-09-30 | above the city average | Criminal acts |
| Break-ins per 1,000 dwellings Period : 2025-10-01 → 2026-09-30 | 6.5 | Criminal acts |
| Year-over-year break-in trend Period : 2025-10-01 → 2026-09-30 | stable | Criminal acts |
| Tree canopy cover Period : 2019 | 27.1% | Tree canopy by neighbourhood (3-30-300 rule) |
| Share of dwellings in condominiums | 15.6% | Property assessment units |
| Year-over-year change in criminal acts Period : 2025-10-01 → 2026-09-30 | 0.4% | Criminal acts |
| Crime rate compared with the city Period : 2025-10-01 → 2026-09-30 | below the city average | Criminal acts |
| Rank by crime rate (1 = lowest) Period : 2025-10-01 → 2026-09-30 | 10 | Criminal acts |
| Criminal acts per 1,000 dwellings Period : 2025-10-01 → 2026-09-30 | 21.5 | Criminal acts |
| Year-over-year crime trend Period : 2025-10-01 → 2026-09-30 | stable | Criminal acts |
| Located criminal acts (last 12 months) Period : 2025-10-01 → 2026-09-30 | 1,786 | Criminal acts |
| Located criminal acts (previous 12 months) Period : 2024-10-01 → 2025-09-30 | 1,779 | Criminal acts |
| Dwellings on the assessment roll | 82,992 | Property assessment units |
| Park area per dwelling compared with the city | below the city average | Large parks, borough parks and public spaces |
| Largest park in the borough | Parc Maisonneuve, Golf municipal de Montréal | Large parks, borough parks and public spaces |
| Median construction year | 1955 | Property assessment units |
| Outdoor recreation facilities | 11 | Outdoor recreational, sports and cultural facilities |
| Outdoor recreational, sports and cultural facilities | 209 | Outdoor recreational, sports and cultural facilities |
| Parks and large parks | 70 | Large parks, borough parks and public spaces |
| Share of land occupied by parks | 11.7% | Large parks, borough parks and public spaces |
| Square metres of park per 1,000 dwellings | 22,312.0 | Large parks, borough parks and public spaces |
| Children's playgrounds | 57 | Outdoor recreational, sports and cultural facilities |
| Dwellings built before 1960 | 61.8% | Property assessment units |
| Outdoor sports facilities | 40 | Outdoor recreational, sports and cultural facilities |
| Most frequent category Period : 2025-10-01 → 2026-09-30 | break-ins | Criminal acts |
| Share of the most frequent category Period : 2025-10-01 → 2026-09-30 | 30.2% | Criminal acts |
Regional context
| Indicator | Value | Source |
|---|---|---|
| Boroughs covered | 19 | Administrative boundaries of the agglomeration |
| Share of the cycling network open in winter, all boroughs | 79.0% | Cycling network |
| Kilometres of cycle lanes, all boroughs | 951 | Cycling network |
| Break-ins per 1,000 dwellings, all boroughs Period : 2025-10-01 → 2026-09-30 | 5.8 | Criminal acts |
| Tree canopy cover, all boroughs Period : 2019 | 24.3% | Tree canopy by neighbourhood (3-30-300 rule) |
| Criminal acts per 1,000 dwellings, all boroughs Period : 2025-10-01 → 2026-09-30 | 24.1 | Criminal acts |
| Share of land occupied by parks, all boroughs | 10.1% | Large parks, borough parks and public spaces |
| Square metres of park per 1,000 dwellings, all boroughs | 46,596.0 | Large parks, borough parks and public spaces |
| Average rent, Montréal CMA: one bedroom Period : 2025 | $1,131 | Average rents (Rental Market Survey) |
| Average rent, Montréal CMA: two bedrooms Period : 2025 | $1,346 | Average rents (Rental Market Survey) |
| Average rent, Montréal CMA: three bedrooms or more Period : 2025 | $1,625 | Average rents (Rental Market Survey) |
| Average rent, Montréal CMA: bachelor Period : 2025 | $1,005 | Average rents (Rental Market Survey) |
| Rent survey year | 2025 | Average rents (Rental Market Survey) |
| Share of criminal acts published without a location Period : 2025-10-01 → 2026-09-30 | 15.2% | Criminal acts |
Comments
No comments yet.