 HoodRadar
borough · Montreal
Pierrefonds-Roxboro by the numbers
The neighbourhood report card
Overall grade : B
- BSafety20.7
- EBreak-ins6.8
- AGreen space291,016.0
- ATree canopy40.4%
How these grades are computed
Grades from A to E, computed automatically from open data (police, city, census). Each criterion ranks this neighbourhood against the other neighbourhoods of the same city: A for the best-placed fifth, E for the lowest fifth. A relative position, not a verdict.
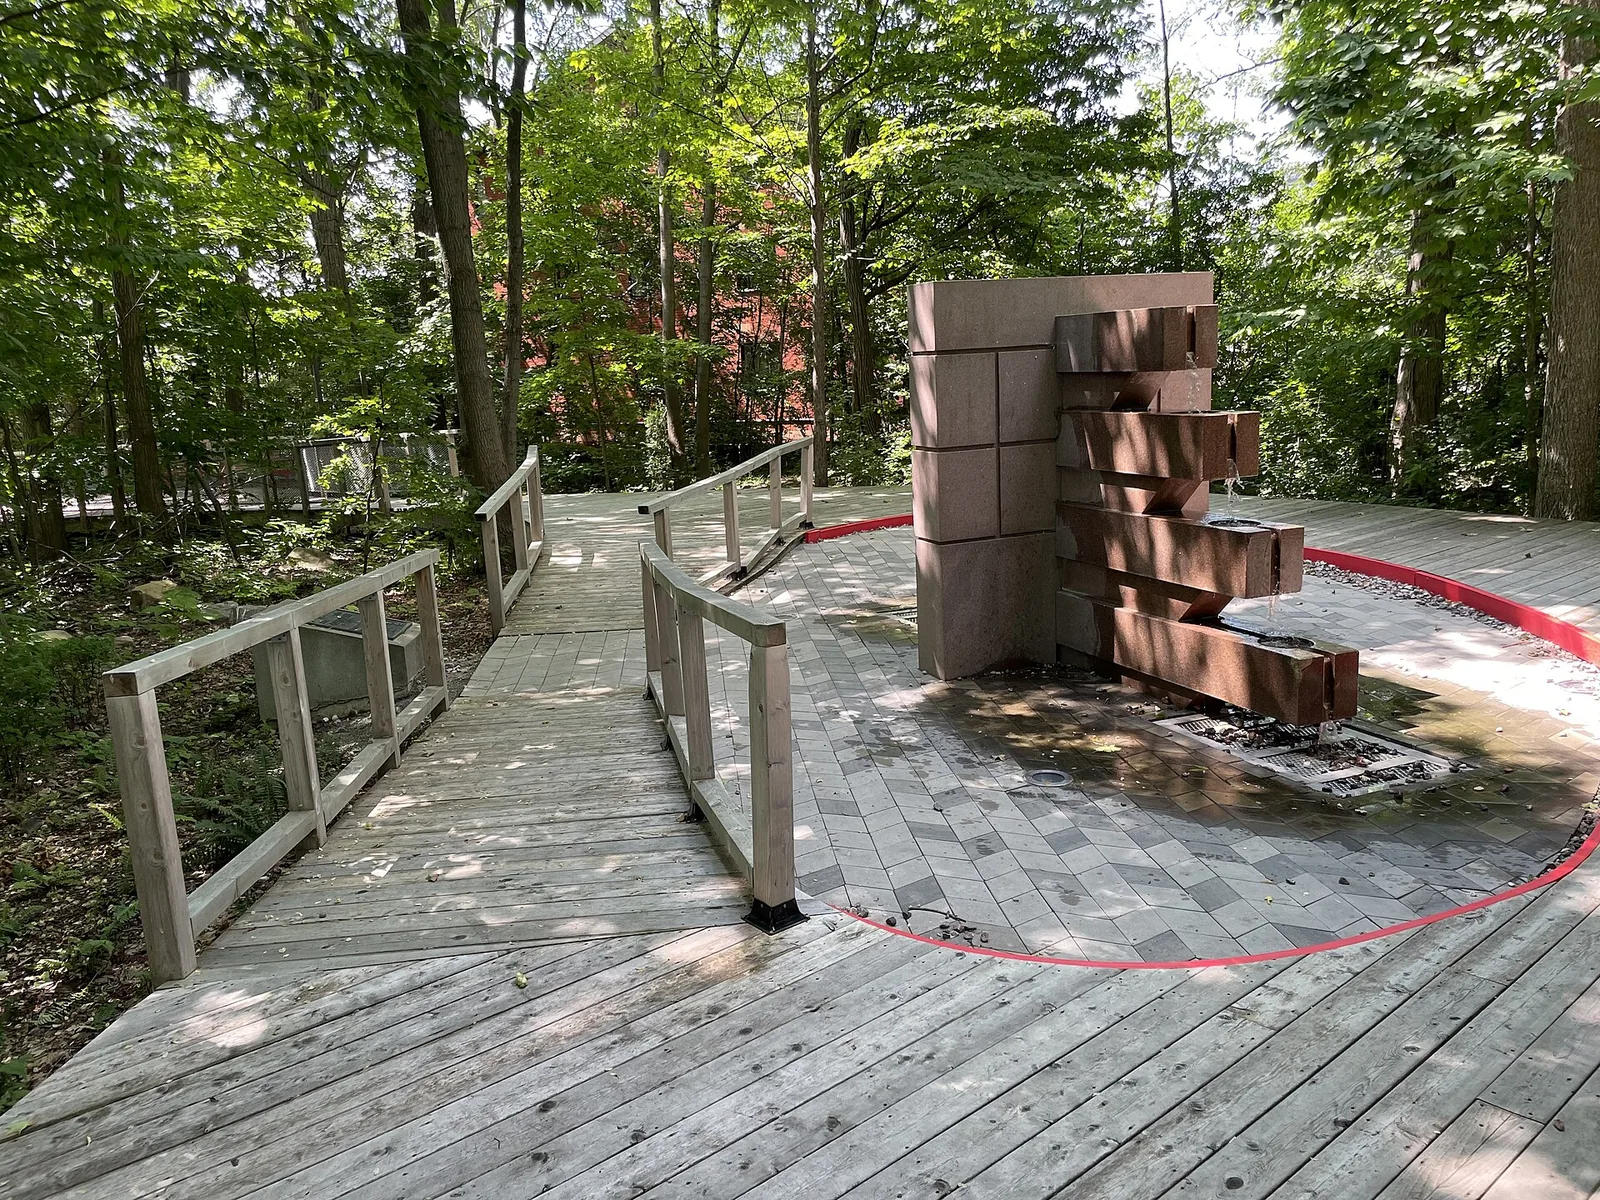
Pierrefonds-Roxboro sits below the city average for crime, with 562 located criminal acts recorded over the most recent full year of data, yet break-ins there run above the city average. The other side of the borough is its green space: parks cover 23.3% of the land, well ahead of the 10.1% measured across Montréal.
Crime and break-ins
Police recorded 562 located criminal acts in Pierrefonds-Roxboro over the most recent full year of data, against 403 in the preceding year — a change of 39.5%, so the trend is rising. Even after that increase, the borough rate stands at 20.7 relative to the number of dwellings, compared with 24.1 citywide, which places Pierrefonds-Roxboro below the city average and gives it rank 8 among Montréal boroughs when they are ordered from the lowest rate upward.
The dominant category is break-ins, at 32.7% of all acts located in the borough. Break-ins alone total 184, a rate of 6.8 against 5.8 for the city as a whole; that puts Pierrefonds-Roxboro above the city average on this measure, and the break-in trend is rising. Read the totals with some caution: across the city, 15.2% of published acts carry no location and therefore fall outside borough counts.
Break-ins per 1,000 dwellings, all boroughs : 5.8
Housing stock
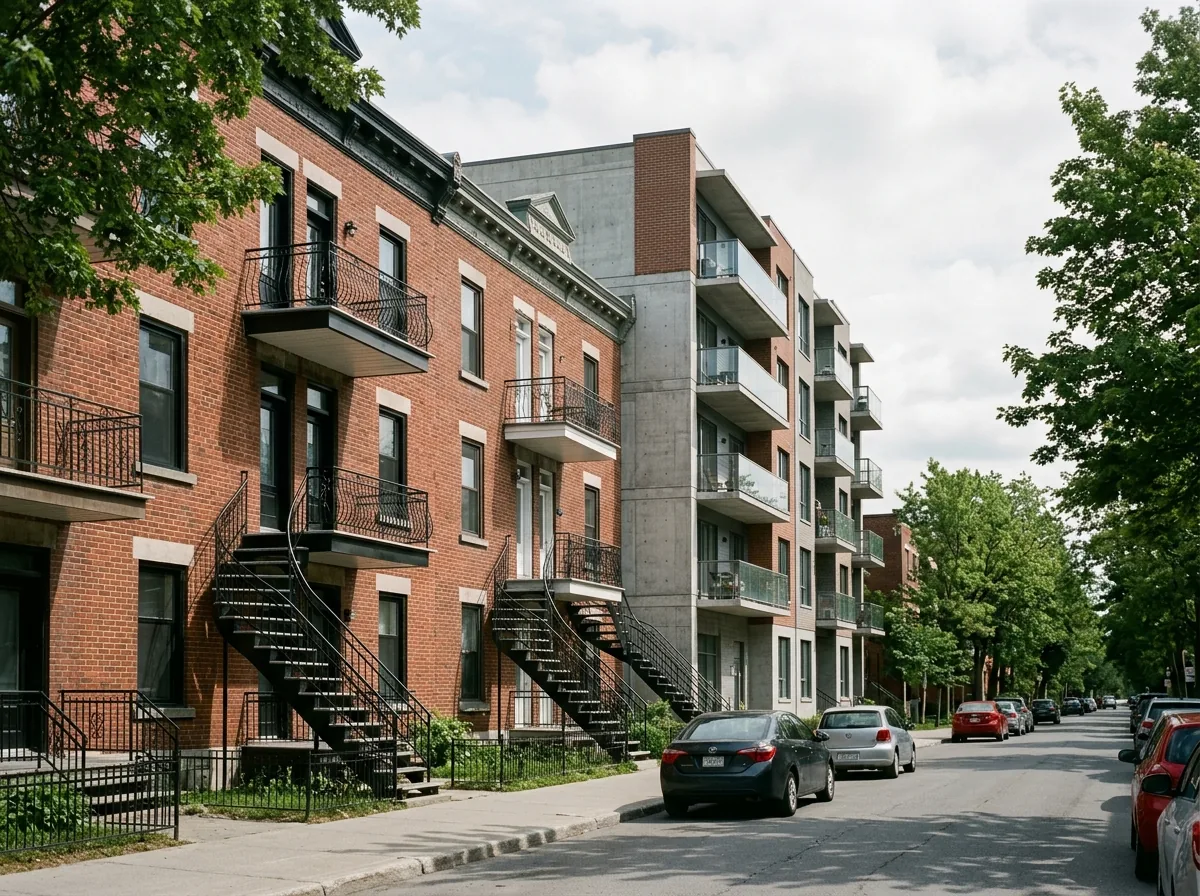
The assessment roll lists 27,181 dwellings in Pierrefonds-Roxboro. Condominium units make up 14.9% of them, so most households here live in detached, semi-detached or rental buildings rather than in co-ownership.
The median construction year is 1977, which makes this a largely post-war borough built out during the suburban decades rather than a pre-war one. Only 13.3% of dwellings date from the older stock, so buyers see fewer of the plaster-and-brick triplexes common closer to the centre, and more of the maintenance questions that come with mid-century and later construction: roofs, windows, foundations of their era.
Parks and outdoor life
The City's inventory, which covers parks and large parks only and excludes private and institutional green space, lists 129 parks in Pierrefonds-Roxboro. Together they occupy 23.3% of the borough's land, against 10.1% citywide. Measured as park area relative to the number of dwellings, Pierrefonds-Roxboro reaches 291,016.0 square metres where the city average is 46,596.0, which puts the borough above the city average. The largest is Grand parc de l' Ouest.
For families, the equipment matters as much as the acreage: 101 children's playgrounds, 69 outdoor sports facilities and 37 outdoor recreation facilities, within a wider inventory of 260 outdoor recreational, sports and cultural installations.
Share of land occupied by parks, all boroughs : 10.1%
Tree canopy cover, all boroughs : 24.3%
What renting costs in the region
CMHC rent figures are collected for the Montréal census metropolitan area, not for Pierrefonds-Roxboro on its own, so treat them as a regional benchmark rather than a local price list. For the 2025 survey, bachelor units averaged $1,005 and smaller apartments $1,131.
Family-sized units averaged $1,346, and the largest units $1,625. In a borough where condominiums account for only 14.9% of dwellings, the rental supply leans toward apartment buildings and rented houses, and asking rents in any given listing can sit some distance from these averages.
Practical notes for newcomers
Because break-ins are above the city average here and account for 32.7% of located acts, it is worth asking sellers or landlords what is already in place: door and frame hardware, lighting at side and rear entrances, and whether the garage or basement access has been secured. Insurers will ask similar questions when you set up a home or tenant policy, and the answers can affect what you pay.
Buyers should line up mortgage pre-approval before shopping, and budget an inspection focused on the age profile of the stock — with a median construction year of 1977, mechanical systems and envelopes are often at the point of replacement. If green space is part of why you are looking here, check which of the 129 parks is actually within walking distance of the address, since the borough's 23.3% of parkland is not spread evenly.
Frequently asked questions
Is Pierrefonds-Roxboro safe compared with other Montréal boroughs?
On the overall measure, yes: the rate of criminal acts relative to the number of dwellings is 20.7, against 24.1 for all boroughs, which is below the city average and gives Pierrefonds-Roxboro rank 8 from the lowest rate upward. Break-ins are the exception, at 6.8 versus 5.8 citywide.
Are break-ins increasing in Pierrefonds-Roxboro?
The break-in trend is rising, with 184 recorded over the most recent full year of data. Overall crime is also rising, moving from 403 to 562 located acts, a change of 39.5%.
How much green space does Pierrefonds-Roxboro have?
The City's inventory counts 129 parks and large parks covering 23.3% of the borough's land, compared with 10.1% citywide. Park area relative to the number of dwellings reaches 291,016.0 square metres, above the city average. The largest is Grand parc de l' Ouest.
All the data
| Indicator | Value | Source |
|---|---|---|
| Share of the cycling network open in winter | 59.5% | Cycling network |
| Kilometres of cycle lanes | 68 | Cycling network |
| Break-ins (last 12 months) Period : 2025-10-01 → 2026-09-30 | 184 | Criminal acts |
| Break-ins compared with the city Period : 2025-10-01 → 2026-09-30 | above the city average | Criminal acts |
| Break-ins per 1,000 dwellings Period : 2025-10-01 → 2026-09-30 | 6.8 | Criminal acts |
| Year-over-year break-in trend Period : 2025-10-01 → 2026-09-30 | rising | Criminal acts |
| Tree canopy cover Period : 2019 | 40.4% | Tree canopy by neighbourhood (3-30-300 rule) |
| Share of dwellings in condominiums | 14.9% | Property assessment units |
| Year-over-year change in criminal acts Period : 2025-10-01 → 2026-09-30 | 39.5% | Criminal acts |
| Crime rate compared with the city Period : 2025-10-01 → 2026-09-30 | below the city average | Criminal acts |
| Rank by crime rate (1 = lowest) Period : 2025-10-01 → 2026-09-30 | 8 | Criminal acts |
| Criminal acts per 1,000 dwellings Period : 2025-10-01 → 2026-09-30 | 20.7 | Criminal acts |
| Year-over-year crime trend Period : 2025-10-01 → 2026-09-30 | rising | Criminal acts |
| Located criminal acts (last 12 months) Period : 2025-10-01 → 2026-09-30 | 562 | Criminal acts |
| Located criminal acts (previous 12 months) Period : 2024-10-01 → 2025-09-30 | 403 | Criminal acts |
| Dwellings on the assessment roll | 27,181 | Property assessment units |
| Park area per dwelling compared with the city | above the city average | Large parks, borough parks and public spaces |
| Largest park in the borough | Grand parc de l' Ouest | Large parks, borough parks and public spaces |
| Median construction year | 1977 | Property assessment units |
| Outdoor recreation facilities | 37 | Outdoor recreational, sports and cultural facilities |
| Outdoor recreational, sports and cultural facilities | 260 | Outdoor recreational, sports and cultural facilities |
| Parks and large parks | 129 | Large parks, borough parks and public spaces |
| Share of land occupied by parks | 23.3% | Large parks, borough parks and public spaces |
| Square metres of park per 1,000 dwellings | 291,016.0 | Large parks, borough parks and public spaces |
| Children's playgrounds | 101 | Outdoor recreational, sports and cultural facilities |
| Dwellings built before 1960 | 13.3% | Property assessment units |
| Outdoor sports facilities | 69 | Outdoor recreational, sports and cultural facilities |
| Most frequent category Period : 2025-10-01 → 2026-09-30 | break-ins | Criminal acts |
| Share of the most frequent category Period : 2025-10-01 → 2026-09-30 | 32.7% | Criminal acts |
Regional context
| Indicator | Value | Source |
|---|---|---|
| Boroughs covered | 19 | Administrative boundaries of the agglomeration |
| Share of the cycling network open in winter, all boroughs | 79.0% | Cycling network |
| Kilometres of cycle lanes, all boroughs | 951 | Cycling network |
| Break-ins per 1,000 dwellings, all boroughs Period : 2025-10-01 → 2026-09-30 | 5.8 | Criminal acts |
| Tree canopy cover, all boroughs Period : 2019 | 24.3% | Tree canopy by neighbourhood (3-30-300 rule) |
| Criminal acts per 1,000 dwellings, all boroughs Period : 2025-10-01 → 2026-09-30 | 24.1 | Criminal acts |
| Share of land occupied by parks, all boroughs | 10.1% | Large parks, borough parks and public spaces |
| Square metres of park per 1,000 dwellings, all boroughs | 46,596.0 | Large parks, borough parks and public spaces |
| Average rent, Montréal CMA: one bedroom Period : 2025 | $1,131 | Average rents (Rental Market Survey) |
| Average rent, Montréal CMA: two bedrooms Period : 2025 | $1,346 | Average rents (Rental Market Survey) |
| Average rent, Montréal CMA: three bedrooms or more Period : 2025 | $1,625 | Average rents (Rental Market Survey) |
| Average rent, Montréal CMA: bachelor Period : 2025 | $1,005 | Average rents (Rental Market Survey) |
| Rent survey year | 2025 | Average rents (Rental Market Survey) |
| Share of criminal acts published without a location Period : 2025-10-01 → 2026-09-30 | 15.2% | Criminal acts |
Comments
No comments yet.