borough · Montreal
Saint-Laurent at a Glance
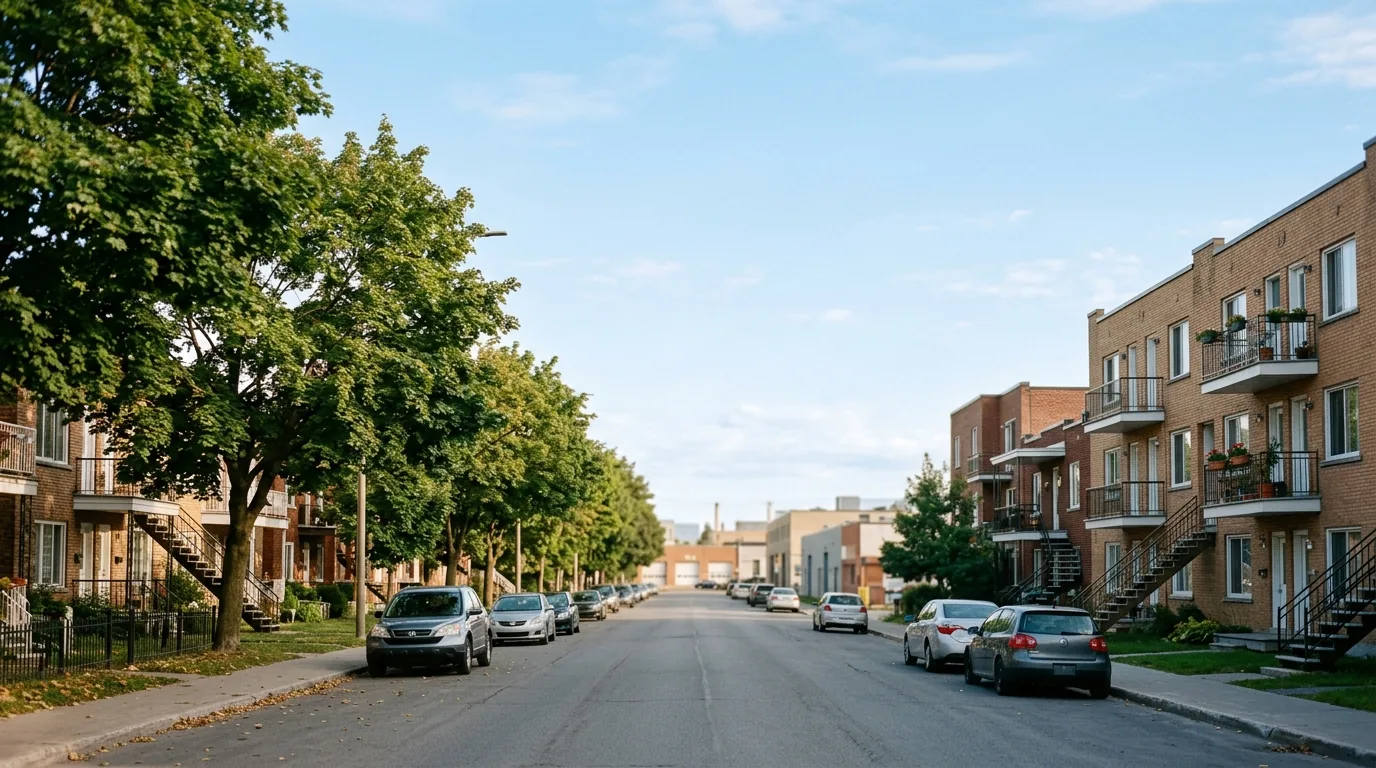
Saint-Laurent counts 45,962 dwellings on the assessment roll, and its crime rate relative to the number of dwellings sits close to the city average, at 24.2 against 23.6 for all boroughs combined. Break-ins are below the city average, while condominium units account for 27.9% of the housing stock. The rent figures on this page are regional averages for the Montréal census metropolitan area, not Saint-Laurent figures.
Safety and reported crime
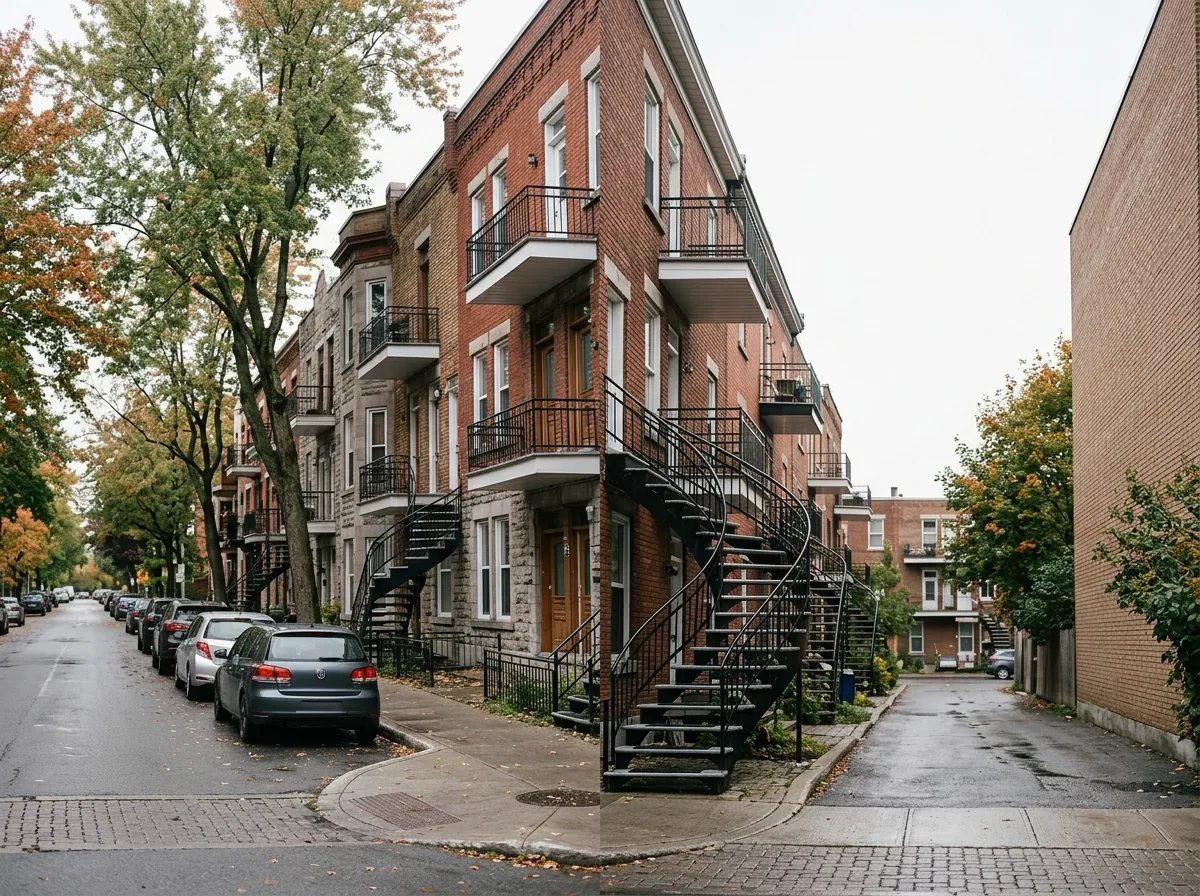
Over the most recent full year of data, police reported 1,112 located criminal acts in Saint-Laurent, compared with 1,169 in the preceding equivalent period, a change of -4.9%. The overall trend is described as stable, and the borough ranks 15 among Montréal boroughs when they are ordered from the lowest crime rate upward.
The most frequent category is vehicle thefts, which accounts for 36.7% of located acts. Break-ins totalled 199, a level below the city average: rated against the number of dwellings, Saint-Laurent records 4.3 compared with 5.8 across all boroughs, and that trend is stable.
One caveat applies everywhere in the city: 15.2% of published criminal acts carry no location and therefore cannot be assigned to any borough. Rates rated against the number of dwellings are useful for comparison, but they are not a measure of personal risk on a given street.
Break-ins per 1,000 dwellings, all boroughs : 5.8
Housing stock
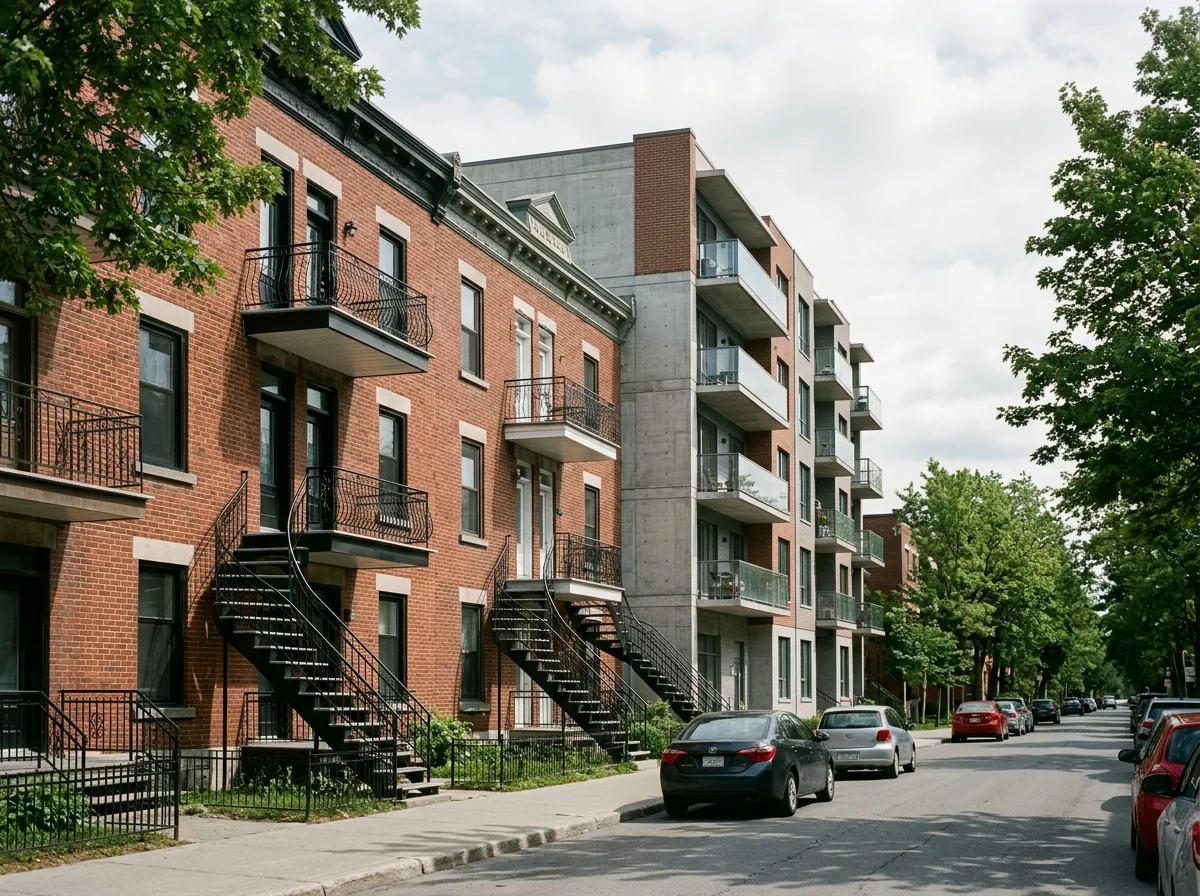
The assessment roll lists 45,962 dwellings in Saint-Laurent. Condominium units make up 27.9% of them, a share that shapes what comes up for sale and what condo fees and co-ownership rules you are likely to encounter.
The median construction year is 1978, and 24.1% of dwellings date from the older part of the stock. That mix means buyers may see both postwar and more recent construction, with inspection priorities differing accordingly: envelope, plumbing and electrical updates in older buildings, reserve funds and common-area maintenance in condominiums.
Rents: regional context
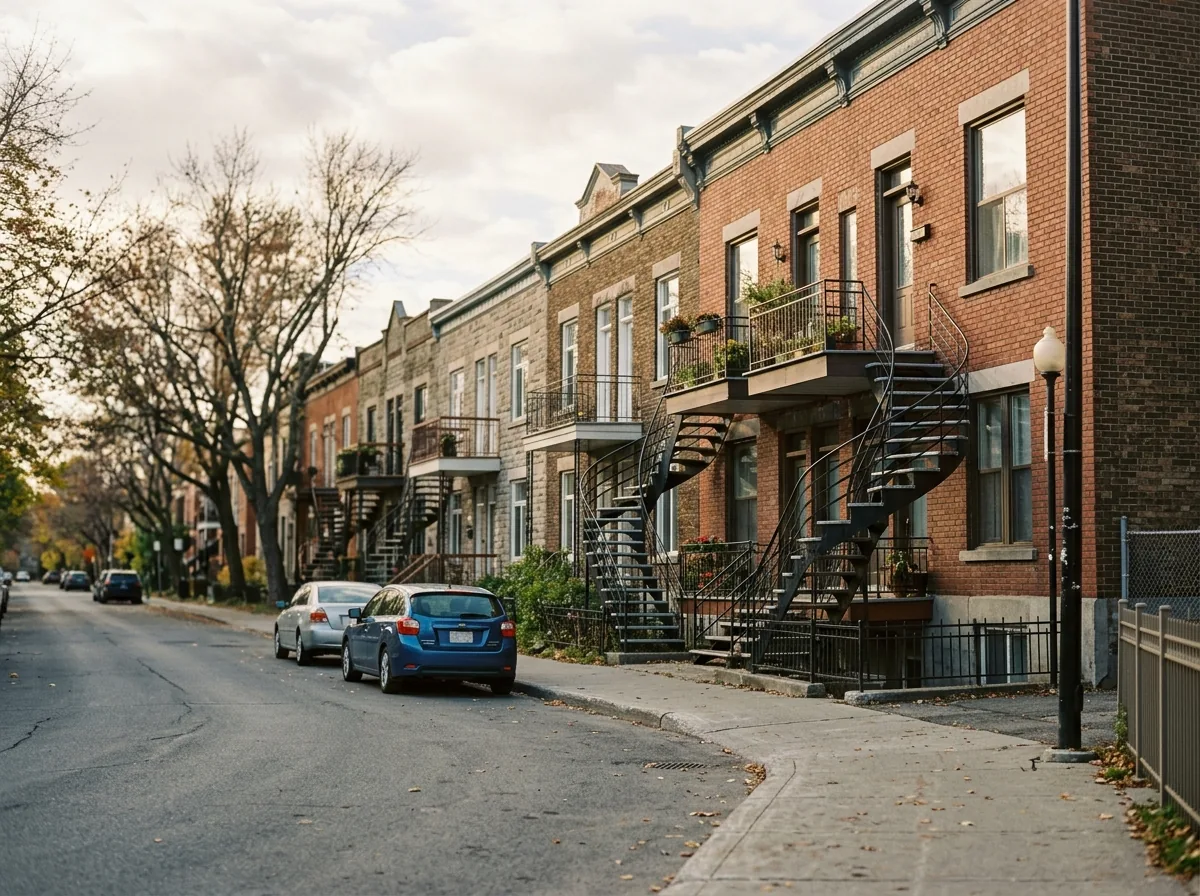
No rent figure is published for Saint-Laurent alone. The amounts below come from the rental market survey covering the Montréal census metropolitan area as a whole for 2025, so treat them as regional context rather than as local asking rents.
Across the metropolitan area, average rents were $1,005 for a bachelor unit, $1,131 for the smallest one-bedroom format, $1,346 for mid-sized apartments and $1,625 for the largest family units. Actual listings in any given borough can sit above or below these averages, since surveys cover existing leases while listings reflect current turnover.
Practical notes for newcomers
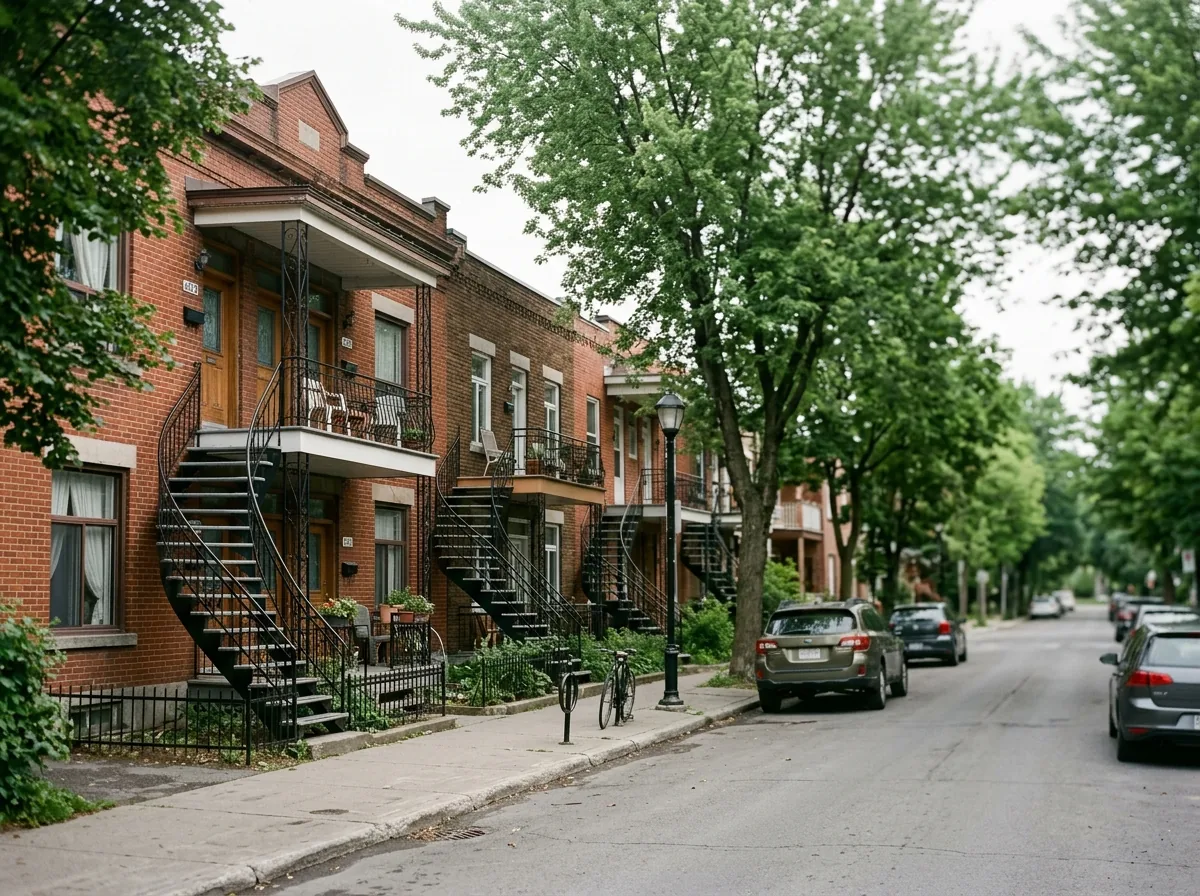
With break-ins below the city average and a rate of 4.3 rated against the number of dwellings, basic precautions remain sensible: solid door hardware, secured ground-floor and balcony openings, and care with vehicles and their contents, given that vehicle thefts form the largest share of reported acts at 36.7%.
If you are renting, ask the landlord what is included and compare the asking price with the regional averages shown above. Home or tenant insurance premiums vary by building type and claims history, so it is worth requesting quotes before you sign. Buyers generally benefit from arranging financing in principle with a lender before visiting, and from budgeting for condo contributions where applicable, since condominium units represent 27.9% of the stock here.
For older properties, an inspection focused on roof, foundation, windows and mechanical systems is especially relevant, as 24.1% of dwellings predate the middle of the last century and the median construction year is 1978. This page summarizes open data and is not professional legal, financial or insurance advice.
Frequently asked questions
Is Saint-Laurent safe compared with other Montréal boroughs?
Its crime rate relative to the number of dwellings is close to the city average, at 24.2 versus 23.6 for all boroughs, and it ranks 15 when boroughs are ordered from the lowest rate upward. The trend is stable, with a change of -4.9% against the previous equivalent period.
How common are break-ins in Saint-Laurent?
Police reported 199 break-ins over the most recent full year of data, a level below the city average. Rated against the number of dwellings, that is 4.3 compared with 5.8 citywide, and the trend is stable.
What do apartments rent for in Saint-Laurent?
No figure is published for the borough alone. For the Montréal census metropolitan area in 2025, average rents were $1,005 for a bachelor unit, $1,131 for the smallest one-bedroom format, $1,346 for mid-sized apartments and $1,625 for the largest family units.
All the data
| Indicator | Value | Source |
|---|---|---|
| Break-ins (last 12 months) Period : 2025-09-01 → 2026-08-31 | 199 | Criminal acts |
| Break-ins compared with the city Period : 2025-09-01 → 2026-08-31 | below the city average | Criminal acts |
| Break-ins per 1,000 dwellings Period : 2025-09-01 → 2026-08-31 | 4.3 | Criminal acts |
| Year-over-year break-in trend Period : 2025-09-01 → 2026-08-31 | stable | Criminal acts |
| Share of dwellings in condominiums | 27.9% | Property assessment units |
| Year-over-year change in criminal acts Period : 2025-09-01 → 2026-08-31 | -4.9% | Criminal acts |
| Crime rate compared with the city Period : 2025-09-01 → 2026-08-31 | close to the city average | Criminal acts |
| Rank by crime rate (1 = lowest) Period : 2025-09-01 → 2026-08-31 | 15 | Criminal acts |
| Criminal acts per 1,000 dwellings Period : 2025-09-01 → 2026-08-31 | 24.2 | Criminal acts |
| Year-over-year crime trend Period : 2025-09-01 → 2026-08-31 | stable | Criminal acts |
| Located criminal acts (last 12 months) Period : 2025-09-01 → 2026-08-31 | 1,112 | Criminal acts |
| Located criminal acts (previous 12 months) Period : 2024-09-01 → 2025-08-31 | 1,169 | Criminal acts |
| Dwellings on the assessment roll | 45,962 | Property assessment units |
| Median construction year | 1978 | Property assessment units |
| Dwellings built before 1960 | 24.1% | Property assessment units |
| Most frequent category Period : 2025-09-01 → 2026-08-31 | vehicle thefts | Criminal acts |
| Share of the most frequent category Period : 2025-09-01 → 2026-08-31 | 36.7% | Criminal acts |
Regional context
| Indicator | Value | Source |
|---|---|---|
| Boroughs covered | 19 | Administrative boundaries of the agglomeration |
| Break-ins per 1,000 dwellings, all boroughs Period : 2025-09-01 → 2026-08-31 | 5.8 | Criminal acts |
| Criminal acts per 1,000 dwellings, all boroughs Period : 2025-09-01 → 2026-08-31 | 23.6 | Criminal acts |
| Average rent, Montréal CMA: one bedroom Period : 2025 | $1,131 | Average rents (Rental Market Survey) |
| Average rent, Montréal CMA: two bedrooms Period : 2025 | $1,346 | Average rents (Rental Market Survey) |
| Average rent, Montréal CMA: three bedrooms or more Period : 2025 | $1,625 | Average rents (Rental Market Survey) |
| Average rent, Montréal CMA: bachelor Period : 2025 | $1,005 | Average rents (Rental Market Survey) |
| Rent survey year | 2025 | Average rents (Rental Market Survey) |
| Share of criminal acts published without a location Period : 2025-09-01 → 2026-08-31 | 15.2% | Criminal acts |
Comments
No comments yet.