 HoodRadar
neighbourhood · Toronto
Clanton Park
The neighbourhood report card
Overall grade : C
- CSafety10.9
- BBreak-ins1.3
- DGreen space14,022.0
- EParkland share2.4%
How these grades are computed
Grades from A to E, computed automatically from open data (police, city, census). Each criterion ranks this neighbourhood against the other neighbourhoods of the same city: A for the best-placed fifth, E for the lowest fifth. A relative position, not a verdict.
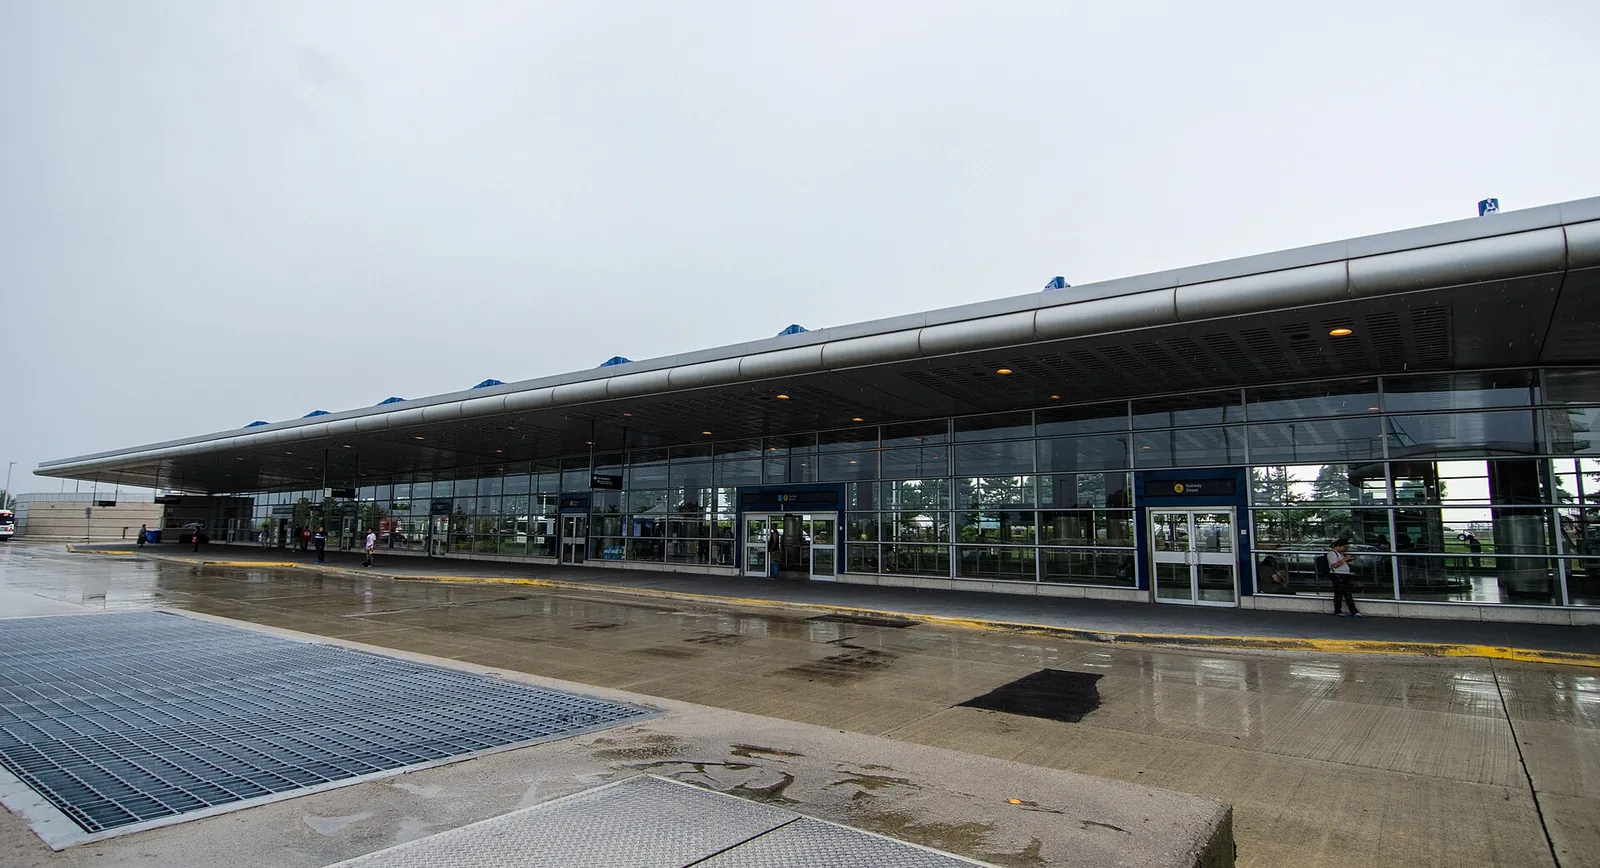
Reported crime in Clanton Park fell over the last year, from 315 major incidents to 229, leaving the neighbourhood below the city average for serious offences. Its housing leans toward apartments, with 43.0% of dwellings in tall buildings and 35.2% in condominiums. Parkland is the weak spot: 11 municipal parks cover 2.4% of the land.
Crime and safety
Toronto Police Service counted 229 major crimes in Clanton Park over the most recent full year of data, down from 315 the year before, a change of -27.3%. The resulting rate is 10.9, measured against population, compared with 13.2 across Toronto as a whole. That places the neighbourhood below the city average, and ranks it 75 among the 158 Toronto neighbourhoods tracked here, counting up from the safest.
The major-crime count groups assaults, break-ins, robberies, vehicle thefts and major thefts. Assaults dominate the local picture: assaults account for 53.7% of incidents, a pattern common in areas with busy arterial roads and apartment clusters. Break-ins are the category most residents ask about. There were 28 of them, a rate of 1.3 against 1.9 citywide, which puts Clanton Park below the city average, and the trend is falling. The broader major-crime trend is likewise falling.
19 of 33: the lowest, the highest and Clanton Park's neighbours.
Break-ins per 1,000 residents in 2025, all of Toronto : 1.9
Housing stock
The census counted 7,155 occupied dwellings in Clanton Park. Apartments shape the streetscape more than houses do: 43.0% of homes sit in tall apartment buildings, and 35.2% of the total stock is condominium tenure, so a fair share of those apartments are owner-occupied rather than purpose-built rental.
Renters make up 45.5% of households, slightly under the Toronto figure of 48.1%. Older construction is still well represented: 25.1% of dwellings date from the early post-war period or before, which usually means lower ceilings on renovation surprises for buyers and a mix of building standards worth checking during an inspection.
19 of 33: the lowest, the highest and Clanton Park's neighbours.
Share of renter households, all of Toronto : 48.1%
Parks and outdoor life
The City of Toronto's municipal parks inventory lists 11 parks in Clanton Park, together covering 2.4% of the land area against 12.5% for the city. Measured per dwelling, park space works out to 14,022.0 where Toronto overall reaches 69,239.0, so the neighbourhood sits below the city average. With so much of the housing in apartments, that green space carries more weight than the raw share suggests.
Elie Wiesel Park is the biggest of them. Families will find 5 children's playgrounds and 7 outdoor sports fields and courts, plus 1 community centre for indoor programming. Private grounds, school yards and provincial land are not part of this count.
14 of 33: the lowest, the highest and Clanton Park's neighbours.
Share of land occupied by parks, all of Toronto : 12.5%
Rents in the Toronto region
CMHC does not publish rent averages at the neighbourhood level, so the figures below describe the whole Toronto region rather than Clanton Park itself. In the 2025 survey, bachelor units averaged $1,491 and smaller units $1,761. Family-sized units averaged $2,045, and the largest units $2,294.
Use them as a benchmark, not a quote. Asking rents in a given building depend on age, condition and whether the unit is condominium stock rented out by its owner — relevant here, given that 35.2% of local dwellings are condos.
Practical notes for newcomers
Break-ins run below the city average in Clanton Park and the trend is falling, so standard precautions are usually enough: solid locks on ground-floor and balcony doors, a lit entrance, and knowing who holds keys in an apartment building. In condominium and rental towers, ask the property manager how visitor access and parking garages are controlled, since parking levels are where vehicle-related incidents cluster.
Renters, who make up 45.5% of households here, should budget for tenant insurance; a building's policy covers the structure, not your belongings or liability. Buyers looking at the 35.2% of stock that is condominium should request the status certificate and reserve fund details before firming up, and arrange mortgage pre-approval early so the offer window is not the moment financing gets sorted out. With 25.1% of dwellings from the older end of the stock, a thorough inspection of wiring, plumbing and windows pays for itself.
Frequently asked questions
Is Clanton Park a safe part of Toronto?
By the police data, yes, on the safer side. Clanton Park recorded 229 major crimes over the latest full year, a rate of 10.9 against 13.2 citywide, which is below the city average. It ranks 75 of 158 neighbourhoods counting from the lowest rate, and the trend is falling, with -27.3% change year over year. Assaults are the most frequent category at 53.7% of incidents.
How common are break-ins in Clanton Park?
Police recorded 28 break-ins in the neighbourhood over the latest year, a rate of 1.3 compared with 1.9 for Toronto. That is below the city average, and the year-over-year trend is falling.
What does it cost to rent near Clanton Park?
No rent average is published for the neighbourhood alone. For the Toronto region in the 2025 CMHC survey, bachelor units averaged $1,491, smaller units $1,761, family-sized units $2,045 and the largest units $2,294. Local asking rents vary, partly because 35.2% of dwellings here are condominiums rented out individually.
All the data
| Indicator | Value | Source |
|---|---|---|
| Break-ins in 2025 Period : 2025 | 28 | Neighbourhood crime rates |
| Break-ins compared with the city Period : 2025 | below the city average | Neighbourhood crime rates |
| Break-ins per 1,000 residents Period : 2025 | 1.3 | Neighbourhood crime rates |
| Year-over-year break-in trend Period : 2025 | falling | Neighbourhood crime rates |
| Community centres | 1 | Parks and recreation facilities |
| Share of dwellings in condominiums Period : 2021 | 35.2% | Neighbourhood profiles, 2021 Census |
| Year-over-year change in major crimes Period : 2025 | -27.3% | Neighbourhood crime rates |
| Major crime rate compared with the city Period : 2025 | below the city average | Neighbourhood crime rates |
| Rank by major crime rate (1 = lowest) Period : 2025 | 75 | Neighbourhood crime rates |
| Major crimes per 1,000 residents Period : 2025 | 10.9 | Neighbourhood crime rates |
| Year-over-year major crime trend Period : 2025 | falling | Neighbourhood crime rates |
| Major crimes reported in 2025 Period : 2025 | 229 | Neighbourhood crime rates |
| Major crimes reported in 2024 Period : 2024 | 315 | Neighbourhood crime rates |
| Occupied dwellings (2021 Census) Period : 2021 | 7,155 | Neighbourhood profiles, 2021 Census |
| Park area per dwelling compared with the city | below the city average | Green spaces |
| Dwellings in buildings of five or more storeys Period : 2021 | 43.0% | Neighbourhood profiles, 2021 Census |
| Largest park in the neighbourhood | Elie Wiesel Park | Green spaces |
| Parks | 11 | Green spaces |
| Share of land occupied by parks | 2.4% | Green spaces |
| Square metres of park per 1,000 dwellings | 14,022.0 | Green spaces |
| Children's playgrounds | 5 | Parks and recreation facilities |
| Population (2025, police estimate) Period : 2025 | 21,057 | Neighbourhood crime rates |
| Dwellings built in 1960 or earlier Period : 2021 | 25.1% | Neighbourhood profiles, 2021 Census |
| Share of renter households Period : 2021 | 45.5% | Neighbourhood profiles, 2021 Census |
| Outdoor sports fields and courts | 7 | Parks and recreation facilities |
| Most frequent category Period : 2025 | assaults | Neighbourhood crime rates |
| Share of the most frequent category Period : 2025 | 53.7% | Neighbourhood crime rates |
Regional context
| Indicator | Value | Source |
|---|---|---|
| Neighbourhoods covered | 158 | Toronto neighbourhoods (158) |
| Kilometres of bike lanes, cycle tracks and trails, all of Toronto | 661 | Cycling network |
| Break-ins per 1,000 residents in 2025, all of Toronto Period : 2025 | 1.9 | Neighbourhood crime rates |
| Major crimes per 1,000 residents in 2025, all of Toronto Period : 2025 | 13.2 | Neighbourhood crime rates |
| Share of land occupied by parks, all of Toronto | 12.5% | Green spaces |
| Square metres of park per 1,000 dwellings, all of Toronto | 69,239.0 | Green spaces |
| Share of renter households, all of Toronto Period : 2021 | 48.1% | Neighbourhood profiles, 2021 Census |
| Average rent, Toronto CMA: one bedroom Period : 2025 | $1,761 | Average rents (Rental Market Survey) |
| Average rent, Toronto CMA: two bedrooms Period : 2025 | $2,045 | Average rents (Rental Market Survey) |
| Average rent, Toronto CMA: three bedrooms or more Period : 2025 | $2,294 | Average rents (Rental Market Survey) |
| Average rent, Toronto CMA: bachelor Period : 2025 | $1,491 | Average rents (Rental Market Survey) |
| Rent survey year | 2025 | Average rents (Rental Market Survey) |
Comments
No comments yet.