 HoodRadar
neighbourhood · Toronto
Living in Danforth, Toronto
The neighbourhood report card
Overall grade : E
- ESafety20.9
- CBreak-ins1.9
- EGreen space505.0
- EParkland share0.2%
How these grades are computed
Grades from A to E, computed automatically from open data (police, city, census). Each criterion ranks this neighbourhood against the other neighbourhoods of the same city: A for the best-placed fifth, E for the lowest fifth. A relative position, not a verdict.
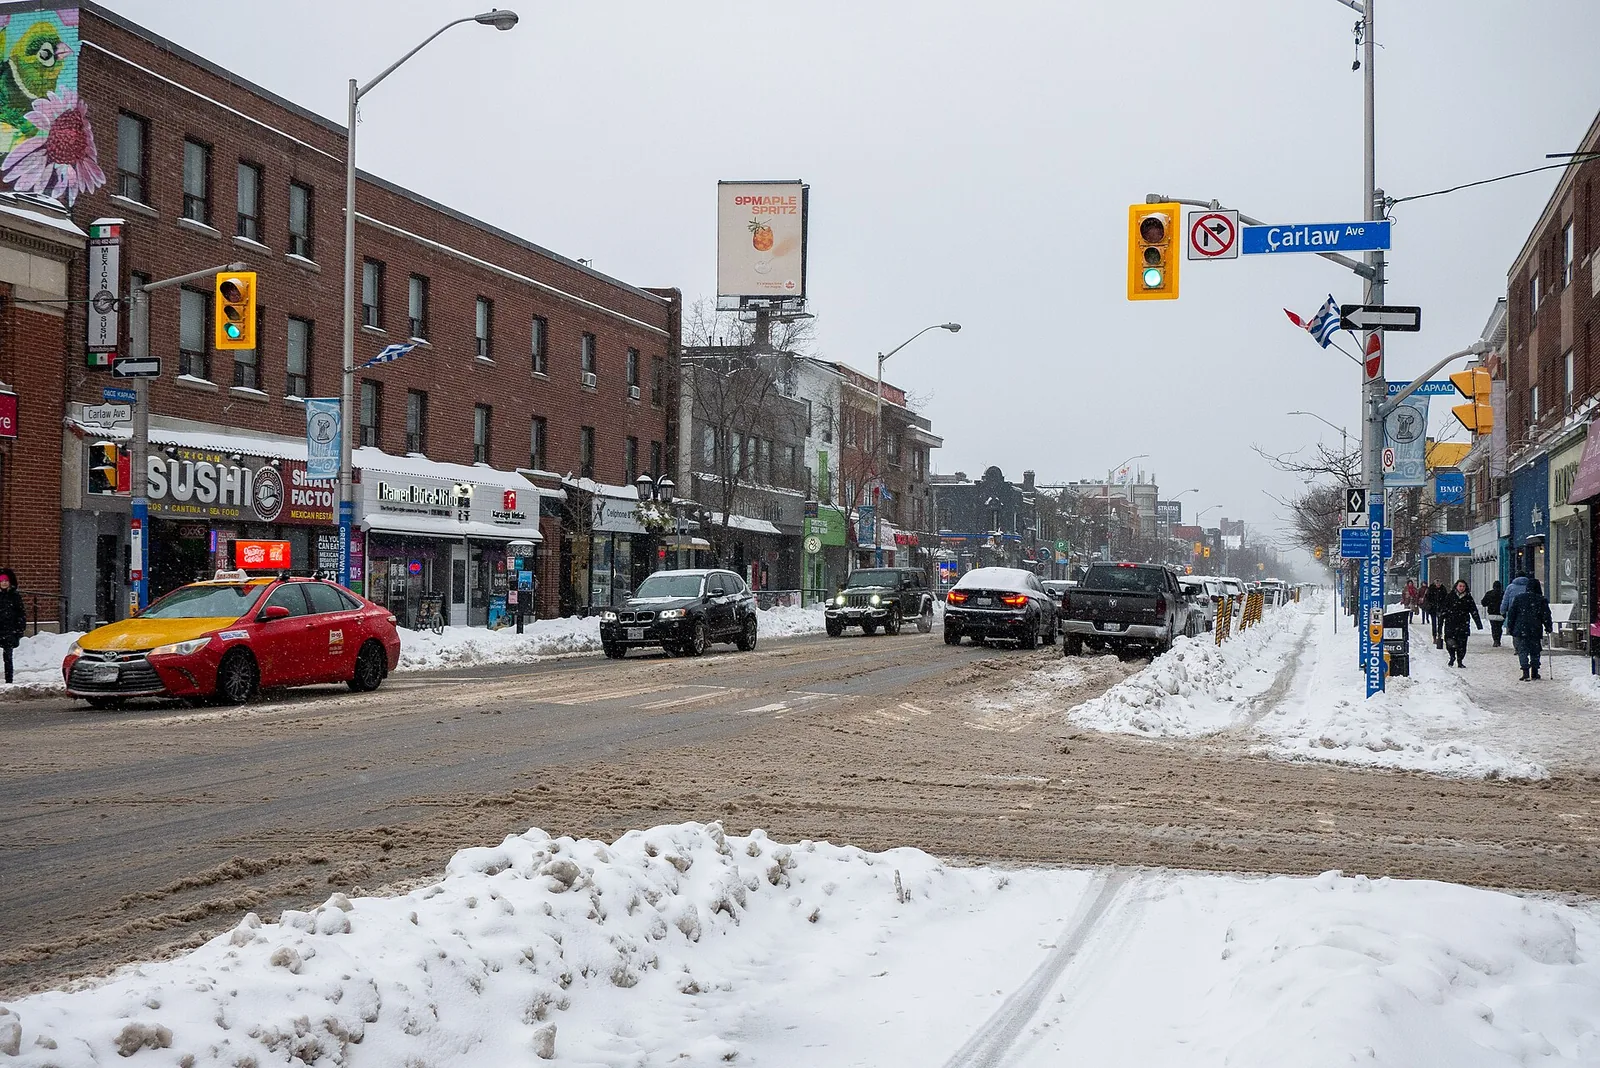
Danforth's major crime rate sits at 20.9, above the city average compared with the rest of Toronto, and has been rising year over year. Housing here leans heavily toward older, low-rise buildings, while green space per dwelling trails the city's own benchmark.
Crime and safety
Police recorded 214 major crimes in Danforth over the latest reporting year, up from 190 the year before, a change of 12.6%. That puts the neighbourhood's rate at 20.9, above the city average next to the citywide rate of 13.2, and the trend here is rising rather than levelling off. Danforth currently ranks 147 among Toronto's neighbourhoods on this measure, where a lower rank means a lower rate.
Assaults make up the largest share of incidents, accounting for 74.8% of everything logged as assaults. Break-ins add 19 to the total, a rate of 1.9 that is close to the city average and also rising, matched almost evenly against the citywide figure of 1.9.
19 of 33: the lowest, the highest and Danforth's neighbours.
Break-ins per 1,000 residents in 2025, all of Toronto : 1.9
Housing stock
Danforth counted 3,910 occupied dwellings at the last census. Condominiums make up 3.1% of that total, while renters occupy 36.7% of households, below the regional renter share of 48.1% across Toronto as a whole.
Tall apartment buildings account for 10.1% of the housing stock, so most homes here are low-rise. A large portion of the neighbourhood, 76.3%, was built in the older construction era the data covers, which tends to mean mature streets and established lots rather than recent development.
19 of 33: the lowest, the highest and Danforth's neighbours.
Share of renter households, all of Toronto : 48.1%
Parks and outdoor life
Danforth has 2 parks within its boundaries, drawn from the City of Toronto's municipal parks inventory, covering 0.2% of the neighbourhood's land. The largest is Langford Parkette. Park area relative to the number of dwellings works out to 505.0, below the city average when set against the citywide figure of 69,239.0, and against a citywide park land share of 12.5%.
Families will find 1 children's playground in the neighbourhood and 1 community centre to draw on for programming and indoor space.
12 of 33: the lowest, the highest and Danforth's neighbours.
Share of land occupied by parks, all of Toronto : 12.5%
Rents in the Toronto area
CMHC's regional survey gives a picture of what renting costs across the Toronto CMA, not a figure specific to Danforth. Bachelor units average $1,491, smaller units average $1,761, family-sized units average $2,045, and the largest units average $2,294 across the region.
Anyone pricing out a move to Danforth should treat these as a regional baseline rather than a quote for this neighbourhood specifically, since local supply, building age and unit mix all shift actual asking rents.
Practical notes for newcomers
With the major crime rate above the city average and still rising, and break-ins close to the city average and rising too, it's reasonable for new residents to look into basic home security measures such as secure locks and visible deterrents before move-in. Renters making up 36.7% of households here may want to confirm whether tenant insurance is already part of a lease or needs to be arranged separately.
Given that 76.3% of the housing stock predates the newer construction era, buyers should ask about any past renovations or inspections tied to older building systems. Anyone financing a purchase benefits from sorting out mortgage pre-approval early, since it clarifies budget before house-hunting in a neighbourhood with a modest condo share of 3.1%.
Frequently asked questions
Is Danforth safer or more dangerous than the rest of Toronto?
Its major crime rate of 20.9 is above the city average compared with the citywide rate of 13.2, and the trend has been rising rather than falling.
How common are break-ins in Danforth?
There were 19 break-ins in the latest year, a rate of 1.9 that is close to the city average relative to the citywide rate of 1.9, and that figure has been rising.
What does the housing stock in Danforth look like?
Among the 3,910 occupied dwellings, 3.1% are condominiums, 10.1% sit in tall apartment buildings, and 76.3% were built in the older construction era the census data covers.
All the data
| Indicator | Value | Source |
|---|---|---|
| Kilometres of bike lanes, cycle tracks and trails | 2 | Cycling network |
| Break-ins in 2025 Period : 2025 | 19 | Neighbourhood crime rates |
| Break-ins compared with the city Period : 2025 | close to the city average | Neighbourhood crime rates |
| Break-ins per 1,000 residents Period : 2025 | 1.9 | Neighbourhood crime rates |
| Year-over-year break-in trend Period : 2025 | rising | Neighbourhood crime rates |
| Community centres | 1 | Parks and recreation facilities |
| Share of dwellings in condominiums Period : 2021 | 3.1% | Neighbourhood profiles, 2021 Census |
| Year-over-year change in major crimes Period : 2025 | 12.6% | Neighbourhood crime rates |
| Major crime rate compared with the city Period : 2025 | above the city average | Neighbourhood crime rates |
| Rank by major crime rate (1 = lowest) Period : 2025 | 147 | Neighbourhood crime rates |
| Major crimes per 1,000 residents Period : 2025 | 20.9 | Neighbourhood crime rates |
| Year-over-year major crime trend Period : 2025 | rising | Neighbourhood crime rates |
| Major crimes reported in 2025 Period : 2025 | 214 | Neighbourhood crime rates |
| Major crimes reported in 2024 Period : 2024 | 190 | Neighbourhood crime rates |
| Occupied dwellings (2021 Census) Period : 2021 | 3,910 | Neighbourhood profiles, 2021 Census |
| Park area per dwelling compared with the city | below the city average | Green spaces |
| Dwellings in buildings of five or more storeys Period : 2021 | 10.1% | Neighbourhood profiles, 2021 Census |
| Largest park in the neighbourhood | Langford Parkette | Green spaces |
| Parks | 2 | Green spaces |
| Share of land occupied by parks | 0.2% | Green spaces |
| Square metres of park per 1,000 dwellings | 505.0 | Green spaces |
| Children's playgrounds | 1 | Parks and recreation facilities |
| Population (2025, police estimate) Period : 2025 | 10,245 | Neighbourhood crime rates |
| Dwellings built in 1960 or earlier Period : 2021 | 76.3% | Neighbourhood profiles, 2021 Census |
| Share of renter households Period : 2021 | 36.7% | Neighbourhood profiles, 2021 Census |
| Most frequent category Period : 2025 | assaults | Neighbourhood crime rates |
| Share of the most frequent category Period : 2025 | 74.8% | Neighbourhood crime rates |
Regional context
| Indicator | Value | Source |
|---|---|---|
| Neighbourhoods covered | 158 | Toronto neighbourhoods (158) |
| Kilometres of bike lanes, cycle tracks and trails, all of Toronto | 661 | Cycling network |
| Break-ins per 1,000 residents in 2025, all of Toronto Period : 2025 | 1.9 | Neighbourhood crime rates |
| Major crimes per 1,000 residents in 2025, all of Toronto Period : 2025 | 13.2 | Neighbourhood crime rates |
| Share of land occupied by parks, all of Toronto | 12.5% | Green spaces |
| Square metres of park per 1,000 dwellings, all of Toronto | 69,239.0 | Green spaces |
| Share of renter households, all of Toronto Period : 2021 | 48.1% | Neighbourhood profiles, 2021 Census |
| Average rent, Toronto CMA: one bedroom Period : 2025 | $1,761 | Average rents (Rental Market Survey) |
| Average rent, Toronto CMA: two bedrooms Period : 2025 | $2,045 | Average rents (Rental Market Survey) |
| Average rent, Toronto CMA: three bedrooms or more Period : 2025 | $2,294 | Average rents (Rental Market Survey) |
| Average rent, Toronto CMA: bachelor Period : 2025 | $1,491 | Average rents (Rental Market Survey) |
| Rent survey year | 2025 | Average rents (Rental Market Survey) |
Comments
No comments yet.