 HoodRadar
neighbourhood · Toronto
Casa Loma at a glance
The neighbourhood report card
Overall grade : C
- CSafety10.3
- EBreak-ins3.2
- CGreen space28,300.0
- BParkland share8.5%
How these grades are computed
Grades from A to E, computed automatically from open data (police, city, census). Each criterion ranks this neighbourhood against the other neighbourhoods of the same city: A for the best-placed fifth, E for the lowest fifth. A relative position, not a verdict.
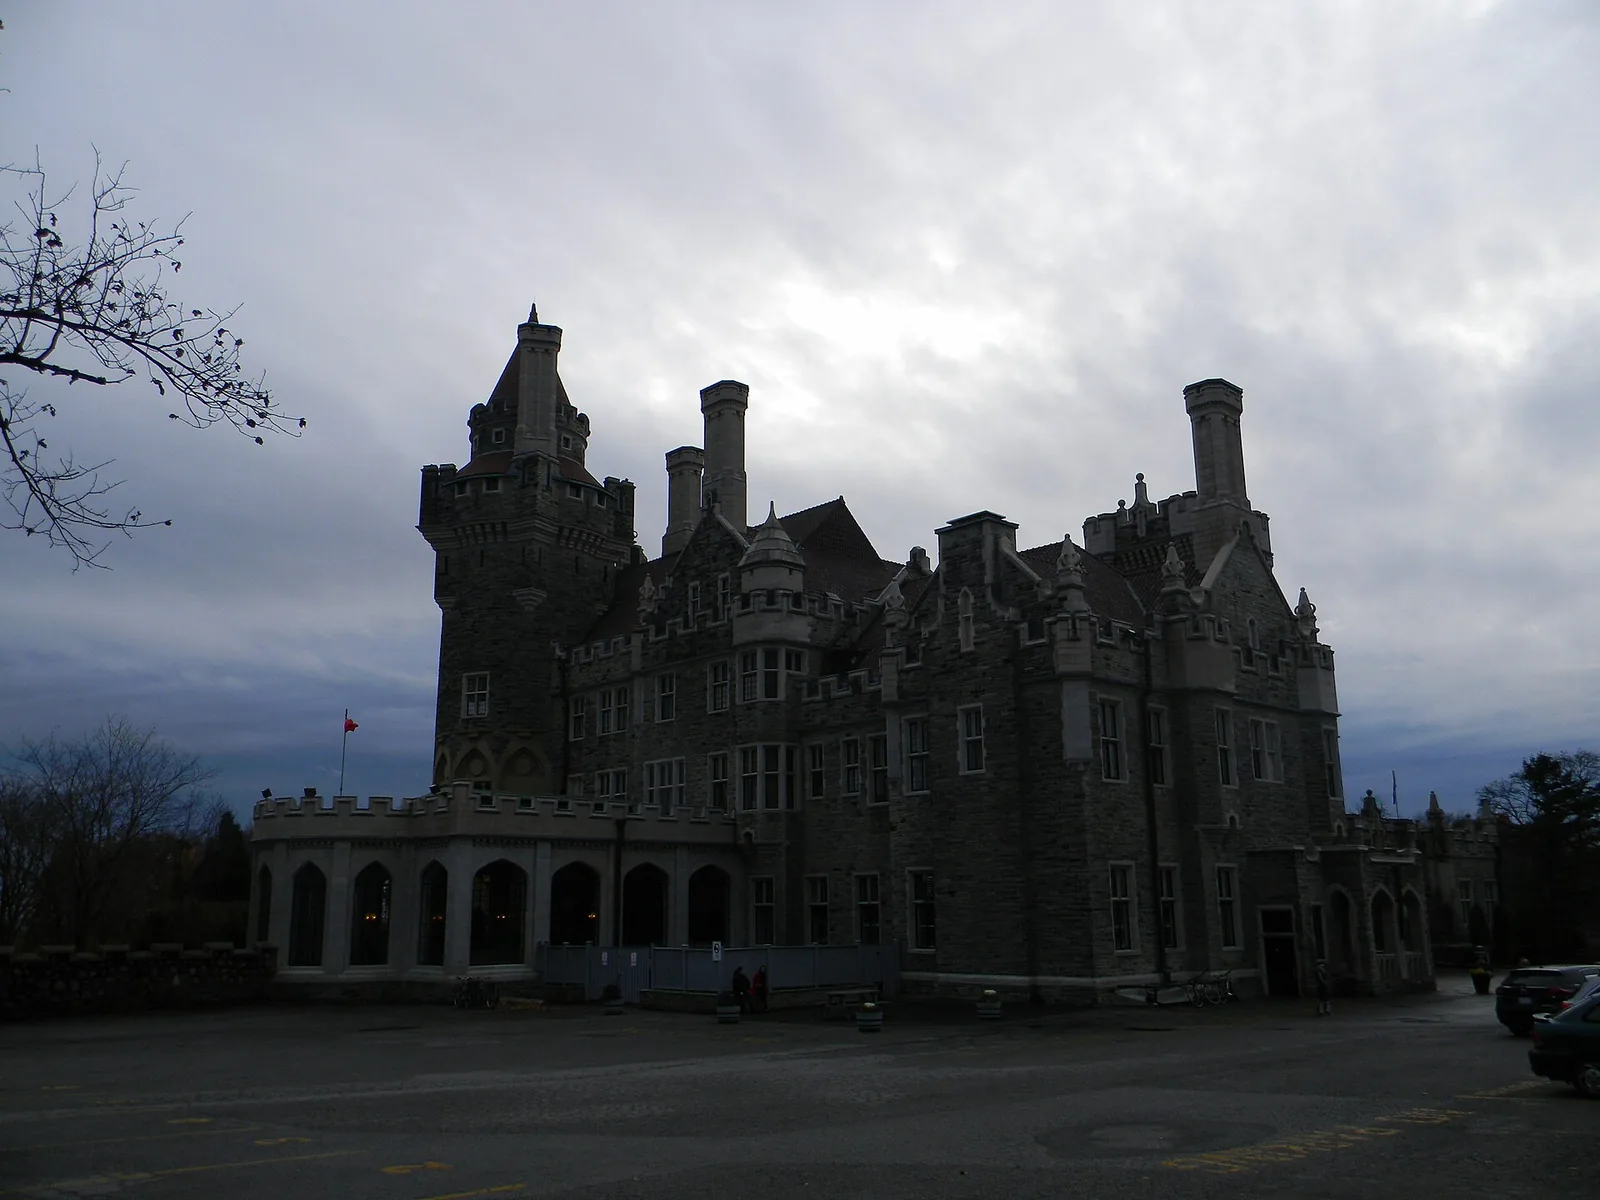
Casa Loma sits on a slope of midtown where prewar houses and tall apartment blocks share the same streets, home to 13,631 residents by the police estimate. Major crime here runs below the city average, at a rate of 10.3 against 13.2 for Toronto as a whole, though break-ins are the exception. Renters make up 56.1% of households, well above the city's 48.1%.
Crime and safety
Toronto Police recorded 140 major crimes in the neighbourhood over the most recent full year of data, against 143 the year before, a change of -2.1%. That counts assaults, break-ins, robberies, vehicle thefts and major thefts together; the pattern is best described as stable. Assaults dominate the file: the most frequent category, assaults, accounts for 55.0% of all incidents.
Measured against population, the neighbourhood comes out at 10.3, below the city average, where Toronto overall sits at 13.2. Among the 158 neighbourhoods tracked across the city, Casa Loma ranks 65 from the safest end of the scale.
Break-ins are the part of the picture that stands out. There were 44 of them, a rate of 3.2 compared with 1.9 citywide, which puts the neighbourhood above the city average. The trend on that category is falling, but houses with side entrances, laneway access and mature hedges remain the usual targets in this kind of streetscape.
12 of 33: the lowest, the highest and Casa Loma's neighbours.
Break-ins per 1,000 residents in 2025, all of Toronto : 1.9
Housing stock
The census counted 5,810 occupied dwellings in Casa Loma. Tall apartment buildings hold 54.8% of them, which is what gives the area its mix of quiet residential blocks and apartment corridors along the main streets. Condominium tenure covers 27.3% of dwellings, so a good share of the apartment supply is rental rather than owner-occupied.
Renter households are the majority at 56.1%, clearly ahead of the Toronto figure of 48.1%. Older construction remains substantial: 43.5% of dwellings date from the early post-war years or before. Buyers looking at those homes should budget for the things that age quietly behind the walls, from knob-and-tube wiring to clay drains, and should expect a home inspection to take longer than it would in newer stock.
17 of 33: the lowest, the highest and Casa Loma's neighbours.
Share of renter households, all of Toronto : 48.1%
Parks and outdoor life
The City of Toronto's municipal parks inventory lists 17 parks in Casa Loma, covering 8.5% of the land, against 12.5% citywide. Sir Winston Churchill Park is the biggest of them. Park area measured against the number of dwellings comes to 28,300.0, below the city average, with Toronto as a whole at 69,239.0 — a predictable result in an area where so many households live stacked in apartment buildings.
For families, the usable inventory matters more than the total hectares: 6 children's playgrounds, 2 outdoor sports fields and courts, and 2 community centres for indoor programming through the winter. Private backyards are limited to the house streets, so the parks carry most of the load.
19 of 33: the lowest, the highest and Casa Loma's neighbours.
Share of land occupied by parks, all of Toronto : 12.5%
What rent looks like in the region
CMHC publishes average rents for the Toronto census metropolitan area, not for individual neighbourhoods, so treat these as regional benchmarks rather than figures for Casa Loma. In the 2025 survey, bachelor units averaged $1,491, smaller units $1,761, family-sized units $2,045 and the largest units $2,294.
Midtown addresses close to transit generally sit above the regional average, and the older low-rise rental stock here can price differently again from purpose-built towers. Use the CMHC numbers to frame a budget, then check current listings on the specific street you are considering.
Before you move in
Because break-ins run above the city average, basic hardening is worth doing before the boxes are unpacked: deadbolts and strike plates on every exterior door, secondary locks on ground-floor and basement windows, lighting on the side and rear approaches, and a camera at the main entrance. In apartment buildings, the weak point is usually the lobby door and the storage locker rather than the unit itself.
Renters, who are the majority of households here at 56.1%, should carry tenant insurance; a landlord's policy covers the building, never your contents or your liability. Buyers in a market with 27.3% of dwellings held as condominiums should read the status certificate and reserve fund study with the same attention they give the inspection report, and arrange mortgage pre-approval before bidding so that financing conditions do not weaken an offer.
Frequently asked questions
Is Casa Loma a safe neighbourhood?
Major crime is below the city average: 140 incidents over the most recent full year, a rate of 10.3 against 13.2 for Toronto, placing the neighbourhood at rank 65 among the 158 neighbourhoods tracked. The qualifier is break-ins, which are above the city average at 3.2.
Is Casa Loma mostly apartments?
Largely, yes. Tall apartment buildings account for 54.8% of the 5,810 occupied dwellings, and 27.3% are condominiums. The rest is older housing: 43.5% of dwellings were built in the early post-war years or before.
How much green space does Casa Loma have?
The municipal inventory lists 17 parks on 8.5% of the land, the largest being Sir Winston Churchill Park. Park area per dwelling, at 28,300.0, is below the city average, with 6 playgrounds and 2 community centres available to residents.
All the data
| Indicator | Value | Source |
|---|---|---|
| Kilometres of bike lanes, cycle tracks and trails | 5 | Cycling network |
| Break-ins in 2025 Period : 2025 | 44 | Neighbourhood crime rates |
| Break-ins compared with the city Period : 2025 | above the city average | Neighbourhood crime rates |
| Break-ins per 1,000 residents Period : 2025 | 3.2 | Neighbourhood crime rates |
| Year-over-year break-in trend Period : 2025 | falling | Neighbourhood crime rates |
| Community centres | 2 | Parks and recreation facilities |
| Share of dwellings in condominiums Period : 2021 | 27.3% | Neighbourhood profiles, 2021 Census |
| Year-over-year change in major crimes Period : 2025 | -2.1% | Neighbourhood crime rates |
| Major crime rate compared with the city Period : 2025 | below the city average | Neighbourhood crime rates |
| Rank by major crime rate (1 = lowest) Period : 2025 | 65 | Neighbourhood crime rates |
| Major crimes per 1,000 residents Period : 2025 | 10.3 | Neighbourhood crime rates |
| Year-over-year major crime trend Period : 2025 | stable | Neighbourhood crime rates |
| Major crimes reported in 2025 Period : 2025 | 140 | Neighbourhood crime rates |
| Major crimes reported in 2024 Period : 2024 | 143 | Neighbourhood crime rates |
| Occupied dwellings (2021 Census) Period : 2021 | 5,810 | Neighbourhood profiles, 2021 Census |
| Park area per dwelling compared with the city | below the city average | Green spaces |
| Dwellings in buildings of five or more storeys Period : 2021 | 54.8% | Neighbourhood profiles, 2021 Census |
| Largest park in the neighbourhood | Sir Winston Churchill Park | Green spaces |
| Parks | 17 | Green spaces |
| Share of land occupied by parks | 8.5% | Green spaces |
| Square metres of park per 1,000 dwellings | 28,300.0 | Green spaces |
| Children's playgrounds | 6 | Parks and recreation facilities |
| Population (2025, police estimate) Period : 2025 | 13,631 | Neighbourhood crime rates |
| Dwellings built in 1960 or earlier Period : 2021 | 43.5% | Neighbourhood profiles, 2021 Census |
| Share of renter households Period : 2021 | 56.1% | Neighbourhood profiles, 2021 Census |
| Outdoor sports fields and courts | 2 | Parks and recreation facilities |
| Most frequent category Period : 2025 | assaults | Neighbourhood crime rates |
| Share of the most frequent category Period : 2025 | 55.0% | Neighbourhood crime rates |
Regional context
| Indicator | Value | Source |
|---|---|---|
| Neighbourhoods covered | 158 | Toronto neighbourhoods (158) |
| Kilometres of bike lanes, cycle tracks and trails, all of Toronto | 661 | Cycling network |
| Break-ins per 1,000 residents in 2025, all of Toronto Period : 2025 | 1.9 | Neighbourhood crime rates |
| Major crimes per 1,000 residents in 2025, all of Toronto Period : 2025 | 13.2 | Neighbourhood crime rates |
| Share of land occupied by parks, all of Toronto | 12.5% | Green spaces |
| Square metres of park per 1,000 dwellings, all of Toronto | 69,239.0 | Green spaces |
| Share of renter households, all of Toronto Period : 2021 | 48.1% | Neighbourhood profiles, 2021 Census |
| Average rent, Toronto CMA: one bedroom Period : 2025 | $1,761 | Average rents (Rental Market Survey) |
| Average rent, Toronto CMA: two bedrooms Period : 2025 | $2,045 | Average rents (Rental Market Survey) |
| Average rent, Toronto CMA: three bedrooms or more Period : 2025 | $2,294 | Average rents (Rental Market Survey) |
| Average rent, Toronto CMA: bachelor Period : 2025 | $1,491 | Average rents (Rental Market Survey) |
| Rent survey year | 2025 | Average rents (Rental Market Survey) |
Comments
No comments yet.