 HoodRadar
neighbourhood · Toronto
Corso Italia-Davenport: What the Numbers Say
The neighbourhood report card
Overall grade : D
- DSafety15.2
- DBreak-ins2.0
- CGreen space24,459.0
- CParkland share6.7%
How these grades are computed
Grades from A to E, computed automatically from open data (police, city, census). Each criterion ranks this neighbourhood against the other neighbourhoods of the same city: A for the best-placed fifth, E for the lowest fifth. A relative position, not a verdict.
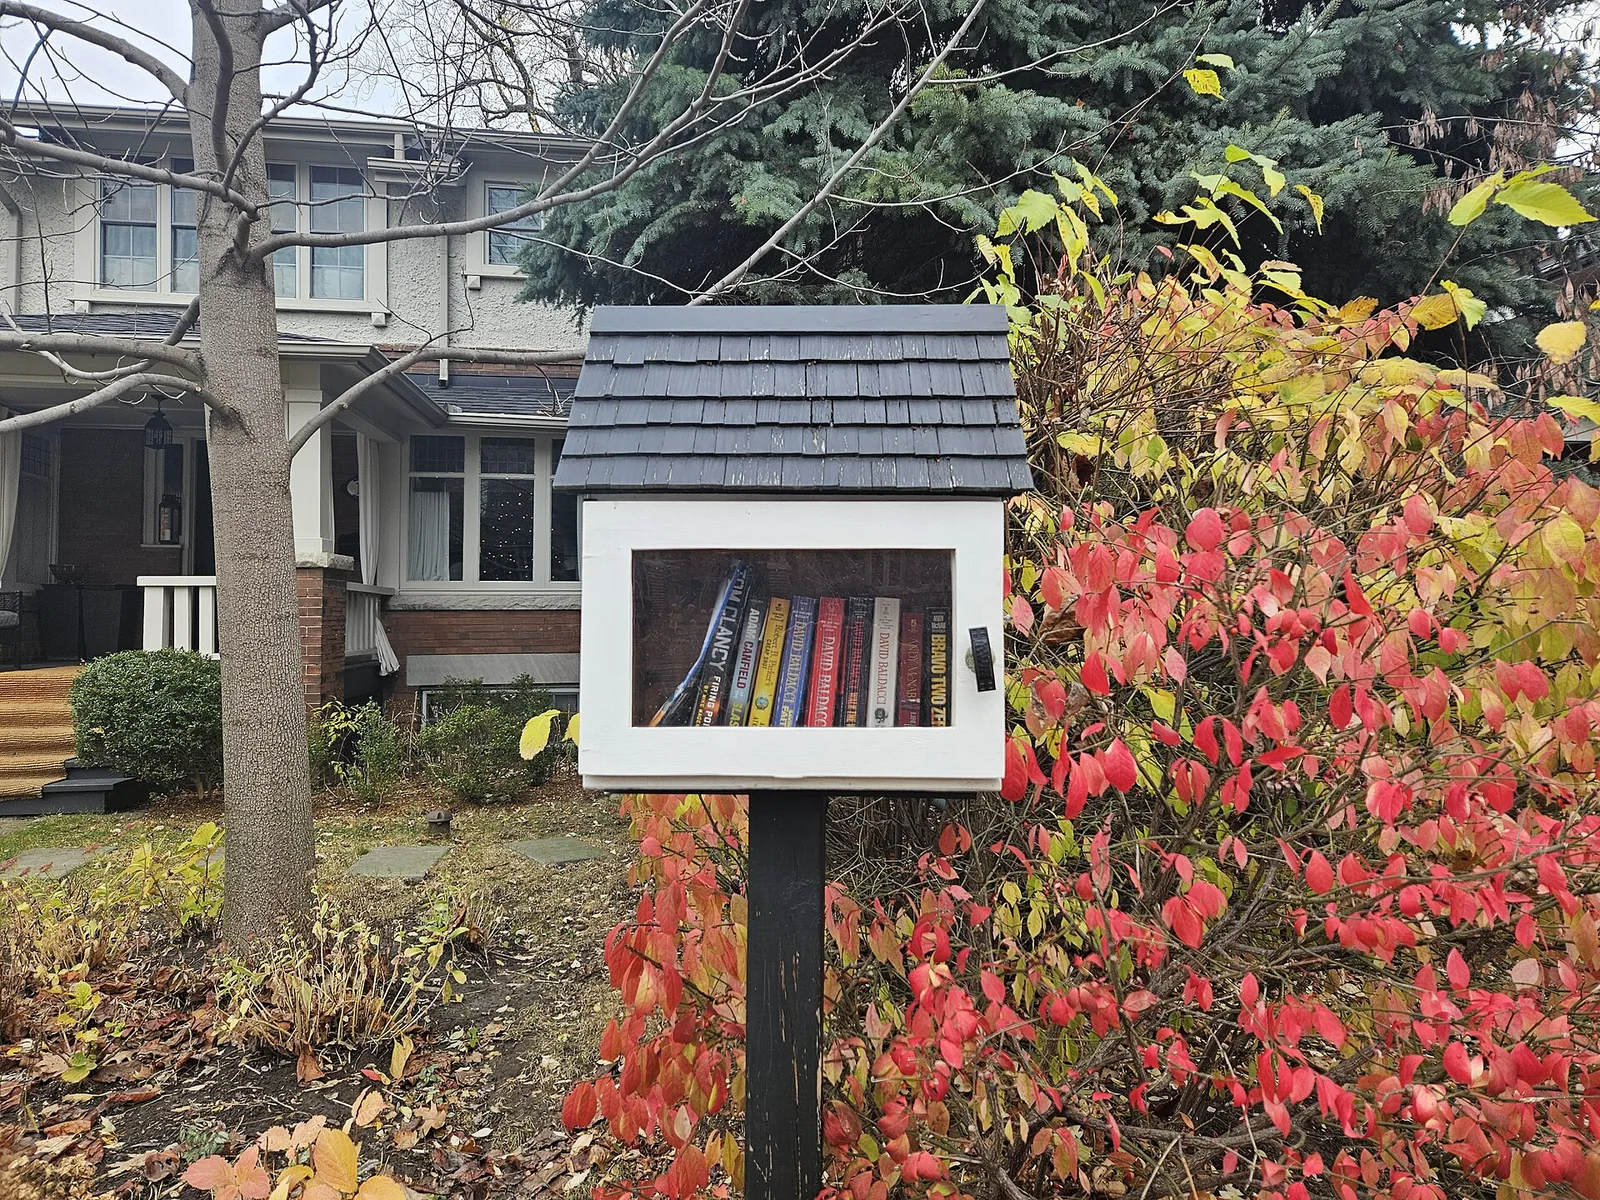
Corso Italia-Davenport is a low-rise, owner-heavy pocket of west Toronto where most homes predate the postwar building boom: 72.2% of dwellings date from the period up to the early postwar years, and the share of homes in tall apartment buildings sits at 0.0%. Police counted 215 major crimes among roughly 14,171 residents last year, a rate of 15.2 against 13.2 for Toronto as a whole. Green space is thinner here than in the average Toronto neighbourhood, with 2 municipal parks covering 6.7% of the land.
Crime and safety
The Toronto Police Service recorded 215 major crimes in Corso Italia-Davenport over the most recent full year of data, down from 234 the year before, a change of -8.1%. Those offences cover assaults, robberies, break-ins, vehicle thefts and major thefts. Assaults dominate the file: assaults account for 65.6% of the total, which is typical of neighbourhoods with commercial strips and nightlife rather than a sign of widespread property risk.
The rate works out to 15.2, above the city average, placing Corso Italia-Davenport at rank 123 out of the 158 neighbourhoods covered here, where the lowest rate ranks first. The year-over-year picture is stable.
Break-ins specifically numbered 28, for a rate of 2.0 against 1.9 across Toronto. That puts the neighbourhood close to the city average, with a stable trend. For someone weighing a house purchase here, residential burglary risk is roughly what it is anywhere in the city; the elevated overall figure is driven by the assault count.
19 of 33: the lowest, the highest and Corso Italia-Davenport's neighbours.
Break-ins per 1,000 residents in 2025, all of Toronto : 1.9
Housing stock
The census counted 5,215 occupied dwellings in Corso Italia-Davenport. The building stock is old and low: 72.2% of homes were built up to the early postwar years, and the share in tall apartment buildings is 0.0%. Expect semis, duplexes, triplexes and houses converted into flats rather than elevator buildings.
Condominiums make up 1.7% of dwellings, so buyers looking for a turnkey unit with a condo board and shared amenities will find very little inventory. Renters make up 36.7% of households, below the Toronto figure of 48.1% — much of the rental supply here is in owner-occupied houses rather than purpose-built blocks, which changes how units are found and how leases are negotiated.
An older stock also means practical questions at the inspection stage: knob-and-tube wiring, clay drains, basement moisture and the state of the roof matter more here than in newer parts of the city.
19 of 33: the lowest, the highest and Corso Italia-Davenport's neighbours.
Share of renter households, all of Toronto : 48.1%
Parks and outdoor life
The City of Toronto's municipal parks inventory lists 2 parks in Corso Italia-Davenport, covering 6.7% of the land against 12.5% citywide. Measured against the number of dwellings, park area comes to 24,459.0 compared with 69,239.0 for Toronto, which makes the neighbourhood below the city average. Privately held or provincially run green space is not counted.
Earlscourt Park is the biggest of them and carries most of the outdoor activity. Families have 1 children's playground and 6 outdoor sports fields and courts to work with, plus 1 community centre for indoor programming through the winter.
With lots this tight and yards this small, households here lean on those few sites heavily. If regular access to open space matters to you, walk Earlscourt Park on a weekend afternoon before committing.
19 of 33: the lowest, the highest and Corso Italia-Davenport's neighbours.
Share of land occupied by parks, all of Toronto : 12.5%
Rents in the Toronto region
CMHC publishes average rents for the Toronto census metropolitan area as a whole, not for individual neighbourhoods, so treat the following as regional context rather than a price list for Corso Italia-Davenport. In the 2025 survey, bachelor units averaged $1,491, smaller units $1,761, family-sized units $2,045 and the largest units $2,294.
Because so much of the local rental supply sits inside older houses rather than purpose-built buildings, listings in this neighbourhood often diverge from those regional averages in both directions: basement and upper-floor flats can land below them, while a full floor of a renovated house can sit well above.
Moving here: practical notes
Buyers should budget for an inspection that takes the age of the stock seriously, and should ask the insurer early what updates — wiring, plumbing, roof — they want documented, since 72.2% of homes here fall into the older bracket. Getting a mortgage pre-approval in hand before touring helps in a market where most sales are freehold houses rather than condos, which represent only 1.7% of dwellings.
Renters should expect to deal with a small landlord rather than a management office, and should confirm in writing who handles heating, snow clearing and repairs. Tenant insurance covers your own contents and liability regardless of what the owner's policy does; with break-ins close to the city average, basic measures such as deadbolts, exterior lighting and secured basement windows are reasonable rather than urgent.
Since assaults account for 65.6% of major crimes recorded here, most of the police file concerns incidents in public and commercial spaces. Visiting the streets you are considering at night, as well as by day, is the most useful check you can make.
Frequently asked questions
Is Corso Italia-Davenport a safe neighbourhood?
Police recorded 215 major crimes in Corso Italia-Davenport over the most recent full year of data, a rate of 15.2 compared with 13.2 for Toronto, which is above the city average. The ranking is 123 among the 158 neighbourhoods covered, counting from the lowest rate up. Break-ins are a separate story: at 2.0 against 1.9 citywide, the neighbourhood is close to the city average.
What kind of housing is available in Corso Italia-Davenport?
Mostly older low-rise houses. Of the 5,215 occupied dwellings, 72.2% date from the period up to the early postwar years, condominiums account for 1.7%, and the share in tall apartment buildings is 0.0%. Renters make up 36.7% of households, below the Toronto share of 48.1%.
Are there enough parks for families?
The City's municipal inventory lists 2 parks covering 6.7% of the land, below the Toronto share of 12.5%. Park area per dwelling is 24,459.0 against 69,239.0 citywide, so the neighbourhood is below the city average. Earlscourt Park is the largest, and there are 1 playground, 6 outdoor fields and courts and 1 community centre.
All the data
| Indicator | Value | Source |
|---|---|---|
| Kilometres of bike lanes, cycle tracks and trails | 1 | Cycling network |
| Break-ins in 2025 Period : 2025 | 28 | Neighbourhood crime rates |
| Break-ins compared with the city Period : 2025 | close to the city average | Neighbourhood crime rates |
| Break-ins per 1,000 residents Period : 2025 | 2.0 | Neighbourhood crime rates |
| Year-over-year break-in trend Period : 2025 | stable | Neighbourhood crime rates |
| Community centres | 1 | Parks and recreation facilities |
| Share of dwellings in condominiums Period : 2021 | 1.7% | Neighbourhood profiles, 2021 Census |
| Year-over-year change in major crimes Period : 2025 | -8.1% | Neighbourhood crime rates |
| Major crime rate compared with the city Period : 2025 | above the city average | Neighbourhood crime rates |
| Rank by major crime rate (1 = lowest) Period : 2025 | 123 | Neighbourhood crime rates |
| Major crimes per 1,000 residents Period : 2025 | 15.2 | Neighbourhood crime rates |
| Year-over-year major crime trend Period : 2025 | stable | Neighbourhood crime rates |
| Major crimes reported in 2025 Period : 2025 | 215 | Neighbourhood crime rates |
| Major crimes reported in 2024 Period : 2024 | 234 | Neighbourhood crime rates |
| Occupied dwellings (2021 Census) Period : 2021 | 5,215 | Neighbourhood profiles, 2021 Census |
| Park area per dwelling compared with the city | below the city average | Green spaces |
| Dwellings in buildings of five or more storeys Period : 2021 | 0.0% | Neighbourhood profiles, 2021 Census |
| Largest park in the neighbourhood | Earlscourt Park | Green spaces |
| Parks | 2 | Green spaces |
| Share of land occupied by parks | 6.7% | Green spaces |
| Square metres of park per 1,000 dwellings | 24,459.0 | Green spaces |
| Children's playgrounds | 1 | Parks and recreation facilities |
| Population (2025, police estimate) Period : 2025 | 14,171 | Neighbourhood crime rates |
| Dwellings built in 1960 or earlier Period : 2021 | 72.2% | Neighbourhood profiles, 2021 Census |
| Share of renter households Period : 2021 | 36.7% | Neighbourhood profiles, 2021 Census |
| Outdoor sports fields and courts | 6 | Parks and recreation facilities |
| Most frequent category Period : 2025 | assaults | Neighbourhood crime rates |
| Share of the most frequent category Period : 2025 | 65.6% | Neighbourhood crime rates |
Regional context
| Indicator | Value | Source |
|---|---|---|
| Neighbourhoods covered | 158 | Toronto neighbourhoods (158) |
| Kilometres of bike lanes, cycle tracks and trails, all of Toronto | 661 | Cycling network |
| Break-ins per 1,000 residents in 2025, all of Toronto Period : 2025 | 1.9 | Neighbourhood crime rates |
| Major crimes per 1,000 residents in 2025, all of Toronto Period : 2025 | 13.2 | Neighbourhood crime rates |
| Share of land occupied by parks, all of Toronto | 12.5% | Green spaces |
| Square metres of park per 1,000 dwellings, all of Toronto | 69,239.0 | Green spaces |
| Share of renter households, all of Toronto Period : 2021 | 48.1% | Neighbourhood profiles, 2021 Census |
| Average rent, Toronto CMA: one bedroom Period : 2025 | $1,761 | Average rents (Rental Market Survey) |
| Average rent, Toronto CMA: two bedrooms Period : 2025 | $2,045 | Average rents (Rental Market Survey) |
| Average rent, Toronto CMA: three bedrooms or more Period : 2025 | $2,294 | Average rents (Rental Market Survey) |
| Average rent, Toronto CMA: bachelor Period : 2025 | $1,491 | Average rents (Rental Market Survey) |
| Rent survey year | 2025 | Average rents (Rental Market Survey) |
Comments
No comments yet.