 HoodRadar
neighbourhood · Toronto
Living in Bridle Path-Sunnybrook-York Mills
The neighbourhood report card
Overall grade : B
- BSafety8.9
- EBreak-ins4.0
- AGreen space231,662.0
- BParkland share8.6%
How these grades are computed
Grades from A to E, computed automatically from open data (police, city, census). Each criterion ranks this neighbourhood against the other neighbourhoods of the same city: A for the best-placed fifth, E for the lowest fifth. A relative position, not a verdict.
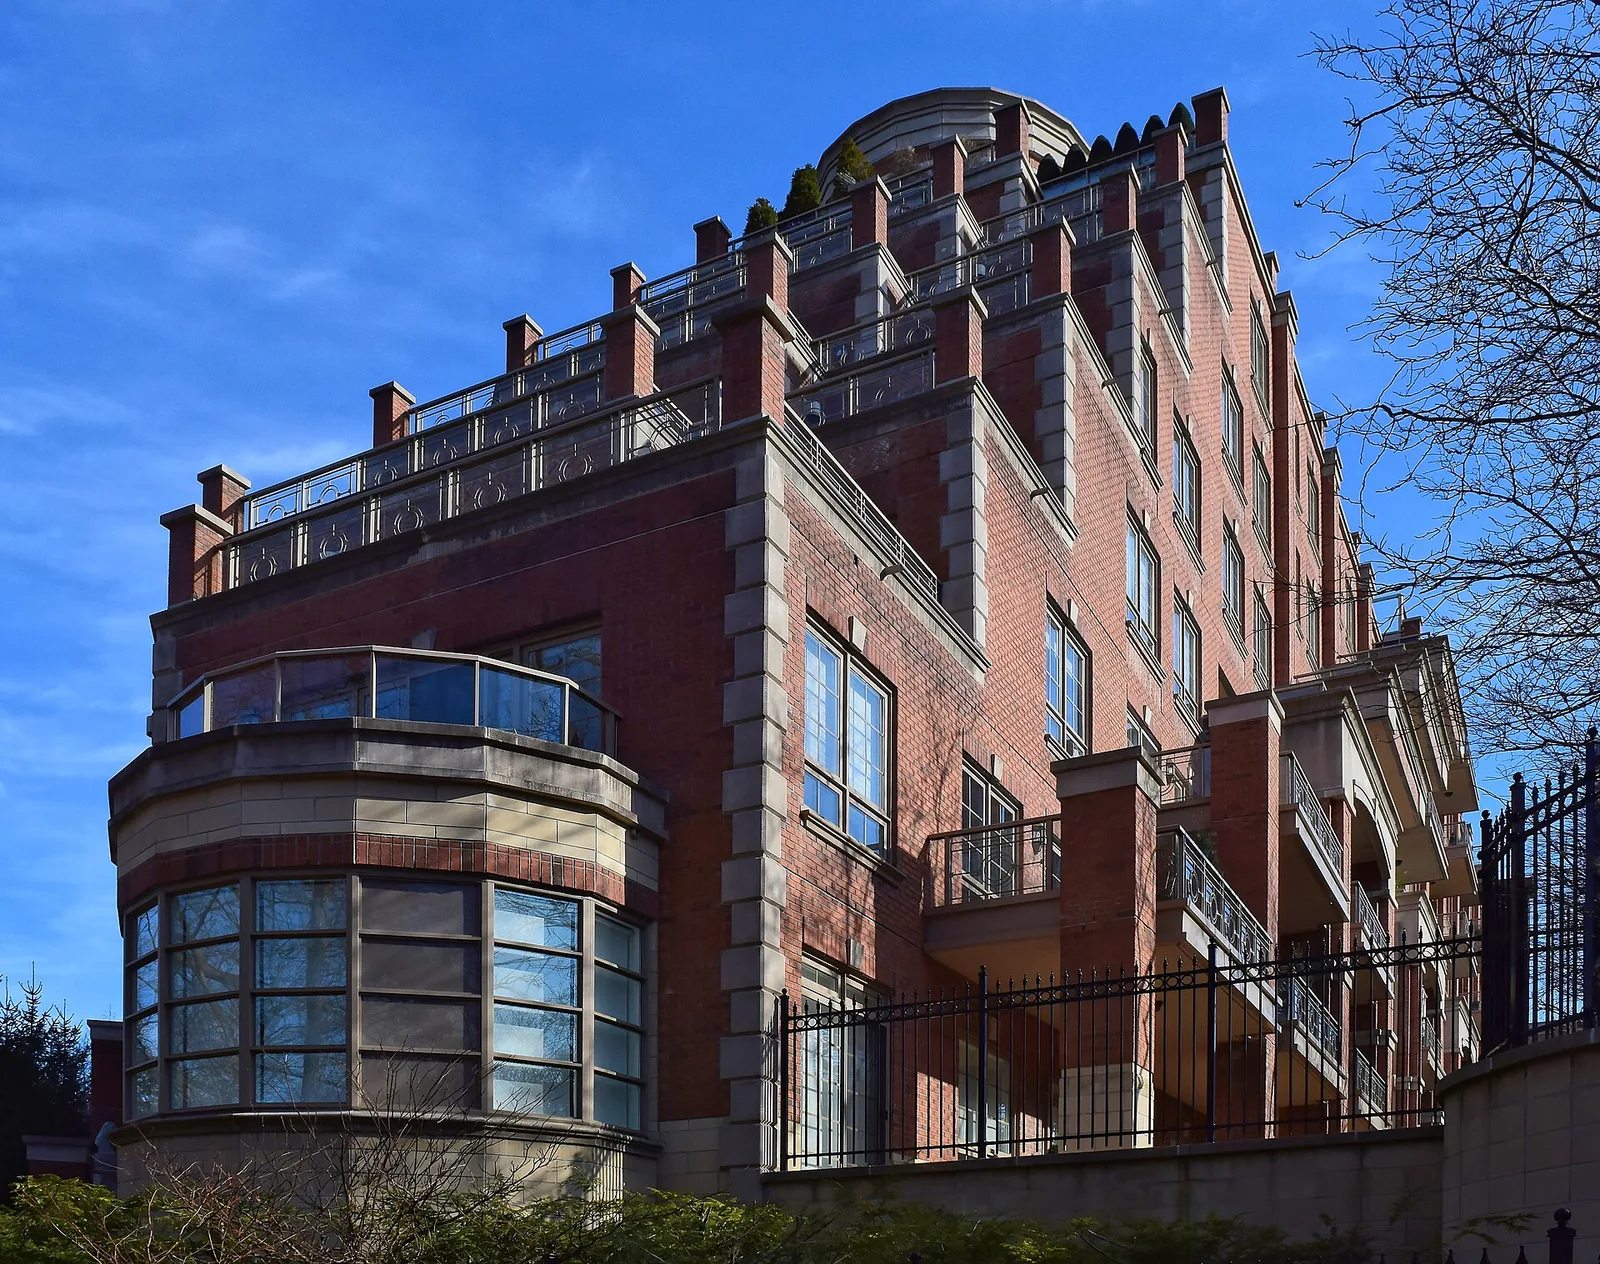
Bridle Path-Sunnybrook-York Mills combines a major crime rate below the city average with break-ins that sit above the city average, a split worth understanding before you commit to the area. Housing here leans toward owner-occupied, lower-density buildings, while the neighbourhood's park coverage stands well above what most of Toronto has access to.
Crime and safety trends
The Toronto Police Service recorded 104 major crimes in this neighbourhood over the latest reporting period, down from 169 the year before, a change of -38.5%. That puts the major crime rate at 8.9, below the city average compared with the citywide rate of 13.2, and the neighbourhood ranks 36 among Toronto's neighbourhoods when sorted from lowest to highest rate.
The category that comes up most often is break-ins, accounting for 45.2% of all incidents logged. Break-ins specifically numbered 47, giving a rate of 4.0 against a citywide figure of 1.9 — so while overall major crime trends falling, break-ins run above the city average even as their own trend is falling.
12 of 33: the lowest, the highest and Bridle Path-Sunnybrook-York Mills's neighbours.
Break-ins per 1,000 residents in 2025, all of Toronto : 1.9
Housing stock
The neighbourhood counted 3,300 occupied dwellings at the last census. Condominiums make up 30.9% of that stock, and renter households account for 11.5%, both figures that point toward a market shaped by ownership rather than rental turnover.
Tall apartment buildings represent 20.3% of dwellings, a modest share that fits with the area's lower-rise character. Older housing built up to the early post-war years makes up 22.4% of the stock, giving a sense of how much of the neighbourhood predates more recent development.
12 of 33: the lowest, the highest and Bridle Path-Sunnybrook-York Mills's neighbours.
Share of renter households, all of Toronto : 48.1%
Parks and outdoor life
Based on the City of Toronto's municipal parks inventory, the neighbourhood has 14 parks covering 8.6% of its land. Park area per dwelling works out to 231,662.0, which is above the city average relative to the citywide figure of 69,239.0 — a meaningful cushion for anyone who values outdoor space.
The largest of these is Windfields Park. Families will find 3 children's playgrounds and 8 outdoor sports fields and courts scattered through the neighbourhood, along with 1 community centre serving local programming.
19 of 33: the lowest, the highest and Bridle Path-Sunnybrook-York Mills's neighbours.
Share of land occupied by parks, all of Toronto : 12.5%
Regional rent context
CMHC's rent figures apply to the Toronto census metropolitan area as a whole, not to this neighbourhood specifically, but they're a useful benchmark for anyone comparing housing costs across the region. Bachelor units averaged $1,491 in 2025, while smaller units (one bedroom) came in at $1,761.
Family-sized units averaged $2,045, and the largest units tracked by CMHC reached $2,294. Regionally, renter households made up 48.1% of all households as of the last census, compared with the much lower renter share found locally in this neighbourhood.
Practical notes for newcomers
With break-ins running above the city average even as the broader crime trend is falling, basic home security measures — secure locks, visible lighting, alarm systems — are a reasonable precaution here, particularly given that break-ins remain the most frequent category at 45.2% of all incidents.
Renters moving in should factor tenant insurance into their budget regardless of neighbourhood statistics; it's a standard safeguard for belongings and liability. Buyers, meanwhile, benefit from securing mortgage pre-approval early, since it clarifies what's affordable before house-hunting begins in a market where ownership, not renting, is the norm locally.
Frequently asked questions
Is Bridle Path-Sunnybrook-York Mills safe?
The major crime rate here is below the city average, at 8.9 compared with 13.2 citywide, and the year-over-year trend is falling. Break-ins are the exception: they run above the city average, with a rate of 4.0 against 1.9 for Toronto overall.
What kind of housing is typical in this neighbourhood?
Most of the 3,300 occupied dwellings are not condominiums; condos account for only 30.9% of the stock. Renter households make up 11.5%, and tall apartment buildings represent 20.3%, reflecting a lower-density, ownership-oriented area.
How much park space is there for residents?
The neighbourhood has 14 municipal parks covering 8.6% of its land, including Windfields Park, the largest. Park area per dwelling is above the city average compared with the citywide average, supported by 3 playgrounds and 8 outdoor sports fields and courts.
All the data
| Indicator | Value | Source |
|---|---|---|
| Kilometres of bike lanes, cycle tracks and trails | 7 | Cycling network |
| Break-ins in 2025 Period : 2025 | 47 | Neighbourhood crime rates |
| Break-ins compared with the city Period : 2025 | above the city average | Neighbourhood crime rates |
| Break-ins per 1,000 residents Period : 2025 | 4.0 | Neighbourhood crime rates |
| Year-over-year break-in trend Period : 2025 | falling | Neighbourhood crime rates |
| Community centres | 1 | Parks and recreation facilities |
| Share of dwellings in condominiums Period : 2021 | 30.9% | Neighbourhood profiles, 2021 Census |
| Year-over-year change in major crimes Period : 2025 | -38.5% | Neighbourhood crime rates |
| Major crime rate compared with the city Period : 2025 | below the city average | Neighbourhood crime rates |
| Rank by major crime rate (1 = lowest) Period : 2025 | 36 | Neighbourhood crime rates |
| Major crimes per 1,000 residents Period : 2025 | 8.9 | Neighbourhood crime rates |
| Year-over-year major crime trend Period : 2025 | falling | Neighbourhood crime rates |
| Major crimes reported in 2025 Period : 2025 | 104 | Neighbourhood crime rates |
| Major crimes reported in 2024 Period : 2024 | 169 | Neighbourhood crime rates |
| Occupied dwellings (2021 Census) Period : 2021 | 3,300 | Neighbourhood profiles, 2021 Census |
| Park area per dwelling compared with the city | above the city average | Green spaces |
| Dwellings in buildings of five or more storeys Period : 2021 | 20.3% | Neighbourhood profiles, 2021 Census |
| Largest park in the neighbourhood | Windfields Park | Green spaces |
| Parks | 14 | Green spaces |
| Share of land occupied by parks | 8.6% | Green spaces |
| Square metres of park per 1,000 dwellings | 231,662.0 | Green spaces |
| Children's playgrounds | 3 | Parks and recreation facilities |
| Population (2025, police estimate) Period : 2025 | 11,654 | Neighbourhood crime rates |
| Dwellings built in 1960 or earlier Period : 2021 | 22.4% | Neighbourhood profiles, 2021 Census |
| Share of renter households Period : 2021 | 11.5% | Neighbourhood profiles, 2021 Census |
| Outdoor sports fields and courts | 8 | Parks and recreation facilities |
| Most frequent category Period : 2025 | break-ins | Neighbourhood crime rates |
| Share of the most frequent category Period : 2025 | 45.2% | Neighbourhood crime rates |
Regional context
| Indicator | Value | Source |
|---|---|---|
| Neighbourhoods covered | 158 | Toronto neighbourhoods (158) |
| Kilometres of bike lanes, cycle tracks and trails, all of Toronto | 661 | Cycling network |
| Break-ins per 1,000 residents in 2025, all of Toronto Period : 2025 | 1.9 | Neighbourhood crime rates |
| Major crimes per 1,000 residents in 2025, all of Toronto Period : 2025 | 13.2 | Neighbourhood crime rates |
| Share of land occupied by parks, all of Toronto | 12.5% | Green spaces |
| Square metres of park per 1,000 dwellings, all of Toronto | 69,239.0 | Green spaces |
| Share of renter households, all of Toronto Period : 2021 | 48.1% | Neighbourhood profiles, 2021 Census |
| Average rent, Toronto CMA: one bedroom Period : 2025 | $1,761 | Average rents (Rental Market Survey) |
| Average rent, Toronto CMA: two bedrooms Period : 2025 | $2,045 | Average rents (Rental Market Survey) |
| Average rent, Toronto CMA: three bedrooms or more Period : 2025 | $2,294 | Average rents (Rental Market Survey) |
| Average rent, Toronto CMA: bachelor Period : 2025 | $1,491 | Average rents (Rental Market Survey) |
| Rent survey year | 2025 | Average rents (Rental Market Survey) |
Comments
No comments yet.